Figures & data
Table 1 Baseline clinical and demographic data (n = 20)
Figure 1 A) Mean ± SE dendritic length (Microns) at 4 sites before and after 18 weeks of topiramate treatment. Significant differences (ANOVA) are shown. B) Mean ± SE nerve fiber density (Fibers/mm) in skin at different sites before and after 18 weeks of topiramate treatment. A significant change was only found in proximal leg.
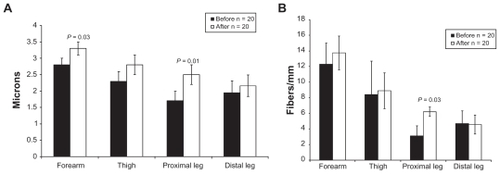
Figure 2 A skin biopsy sample before and after treatment with topiramate shows an increase in the intraepidermal nerve fiber density (epidermis indicated by box at arrow) and dendritic length after treatment.
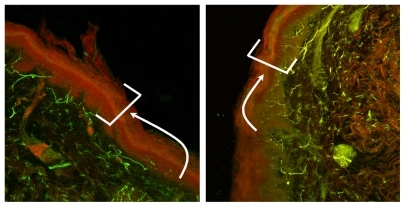
Table 2 Variables with significant changes from baseline to 18 weeks post-initiation of treatment with topiramate