
Figures & data
Figure 1 Study flowchart.
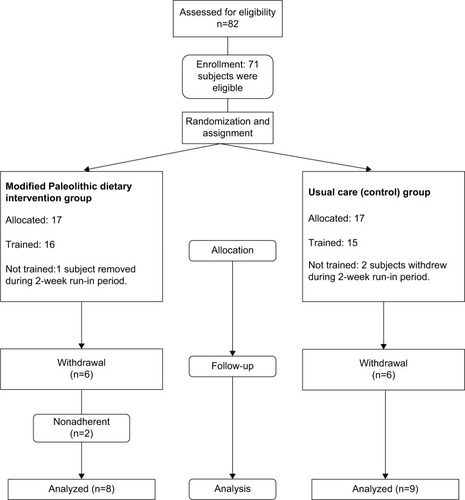
Table 1 Baseline characteristics of subjects in control and MPDI groups
Figure 2 Mean FSS scores at baseline and postprotocol in control and MPDI groups (A). Each bar represents the mean score from the nine questions of the FSS for each subject group (abscissa) at baseline (black bars) and postprotocol (crosshatch bars). Error bars indicate ± SE. Changes in FSS scores of individual control (C1–C9) and MPDI (D1–D8) subjects from baseline to postprotocol (B); * denotes significant difference.
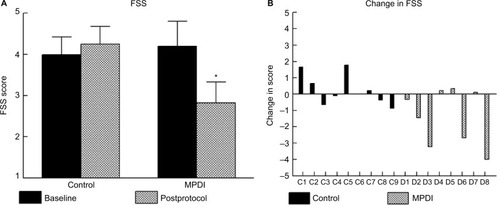
Figure 3 Mean changes in MSQOL-M (A) and MSQOL-P (C). Each bar represents the mean score for the MSQOL mental (A) and physical (C) health domains for subject groups (abscissa) at baseline (black bars) and postprotocol (crosshatch bars). Error bars indicate ± SE. Changes in MSQOL scores of individual control (C1–C9) and MPDI (D1–D8) subjects from baseline to postprotocol for mental (B) and physical (D) health domains. * denotes significant difference.
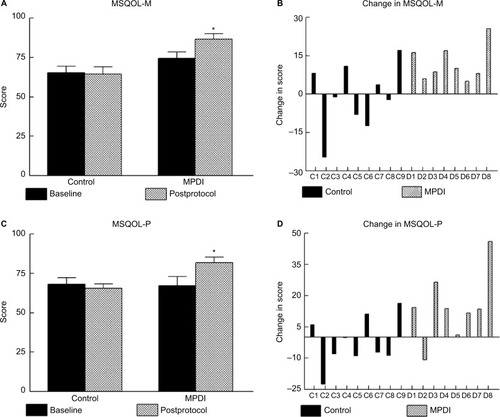
Figure 4 Average changes in motor tests for each group: dominant hand 9-HPT (A), nondominant hand 9-HPT (B), 25-FW (C), and 6-MW (D).
Abbreviations: SE, standard error; 9-HPT, 9-Hole Peg Test; 25-FW, 25-Foot Walk; 6-MW, 6-minute walk; MPDI, modified Paleolithic dietary intervention.
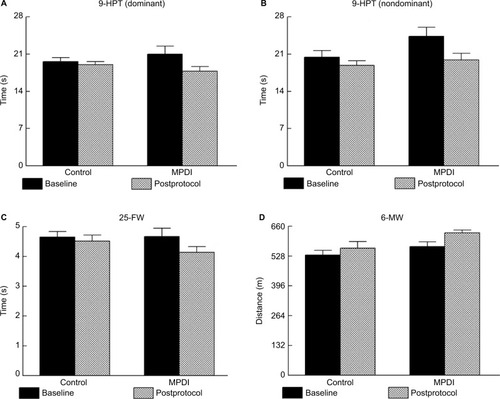
Figure 5 Average changes in blood serum concentrations of vitamins K (A), B-1 (B), B-9 (C), B-12 (D), Hs-CRP (E), and HCY (F).
Abbreviations: MPDI, modified Paleolithic dietary intervention; SE, standard error; HCY, homocysteine.
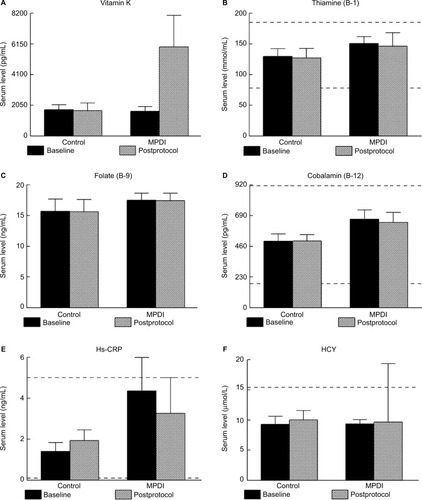
Figure S1 Food Log.
Abbreviations: C, cup; svg, serving; tbs, tablespoon.
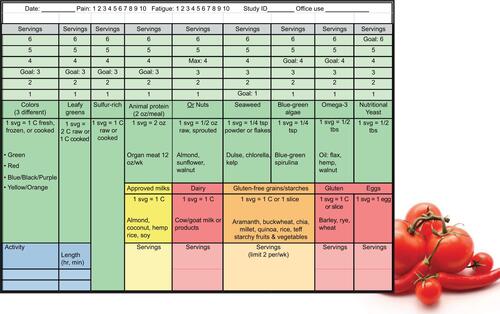
Figure S2 Food Diary.

Table S1 Adherence