Figures & data
Table 1 Detectable mean change in outcome measures for sample size of n=20 at 0.05 significance level with 0.80 power
Figure 1 Flowchart of the screening, enrollment, and follow-up of participants in the study.
Source: Copyright ©2014. Dove Medical Press. Reproduced from Bisht B, Darling WG, Shivapour ET, et al. Multimodal intervention improves fatigue and quality of life of subjects with progressive multiple sclerosis: a pilot study. Degenerat Neurol Neuromuscul Dis. 2015;2015(5):19–35.Citation20
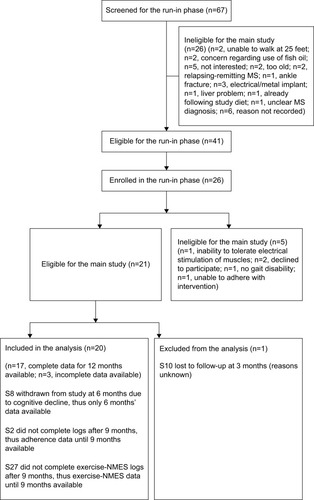
Figure 2 Time to complete timed up and go test at baseline, 3, 6, 9, and 12 months of the entire cohort (n=20), responders (n=10) and nonresponders (n=10).
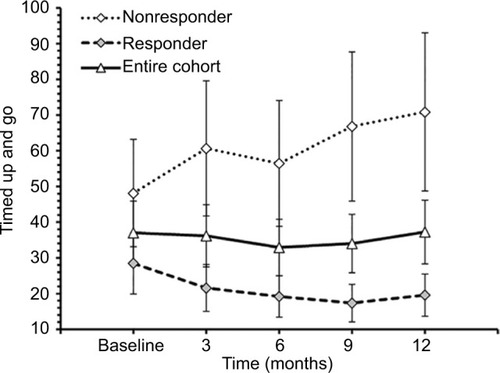
Figure 3 Walking speed during 25-foot walk test at baseline, 3, 6, 9, and 12 months of the entire cohort (n=20), responders (n=10) and nonresponders (n=10).
Abbreviation: TUG, timed up and go.
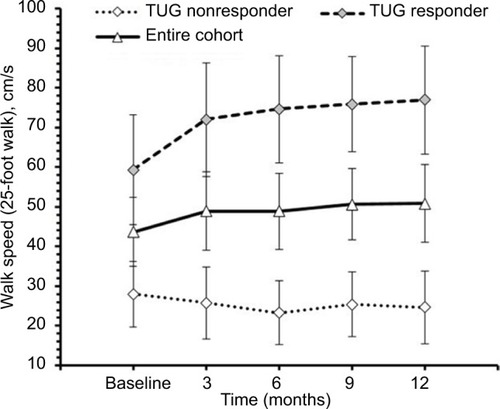
Figure 4 Speed to walk toward 10 feet mark during timed up and go test at baseline, 3, 6, 9, and 12 months of the entire cohort (n=20), responders (n=10) and nonresponders (n=10).
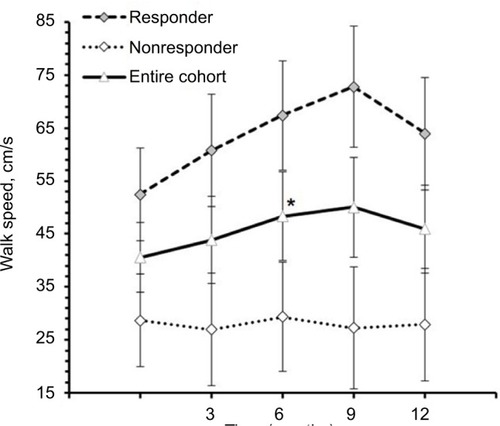
Table 2 Mean change (95% CI) at 6, 9, and 12 months (all subjects)
Figure 5 Berg Balance Scale scores of the entire cohort (n=20), and responders (n=10) and nonresponders (n=10) to TUG test at baseline (B), 3, 6, 9, and 12 months.
Abbreviation: TUG, timed up and go.
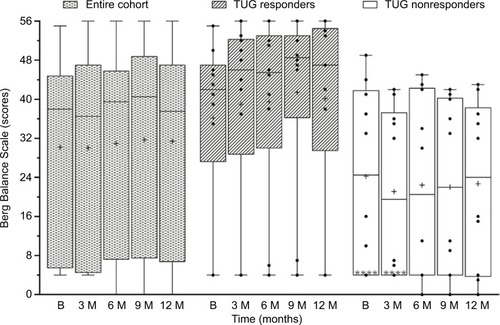
Table 3 Mean change (95% CI) at 6, 9, and 12 months for responder and nonresponder
Figure 6 Spatio temporal gait parameters during timed up and go test at baseline, 3, 6, 9, and 12 months of responders (n=10) and nonresponders (n=10).
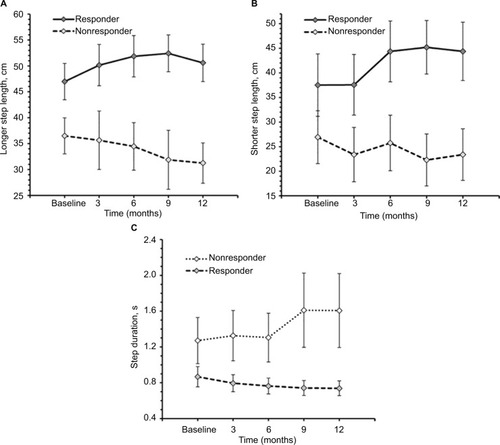
Table 4 Baseline variables – responder vs nonresponder
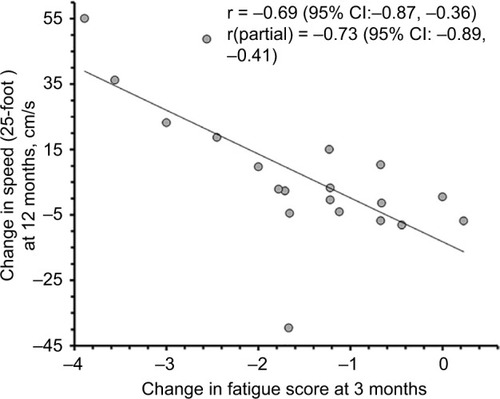
Figure 7 Correlation between changes in fatigue severity scale scores over 3 months and change in 25-foot walk speed over 12 months.
Abbreviations: CI, confidence interval.