
Figures & data
Table 1 Videofluoroscopic dysphagia scale
Figure 1 Position of the four sensors of the transducer probe in videomanofluorometry.
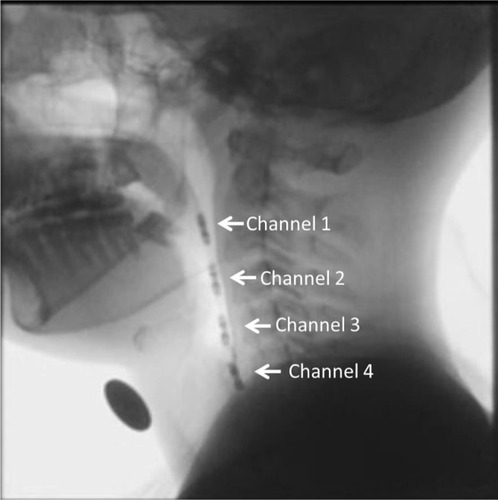
Figure 2 Maximum pressures in the hypopharynx in channels 1–3 were measured from the highest peak of a waveform to the base line, and pressure change in the UES in channel 4 was measured from a higher peak, that is, maximum closing UES pressure, to the bottom of a waveform, that is, minimum opening UES pressure.
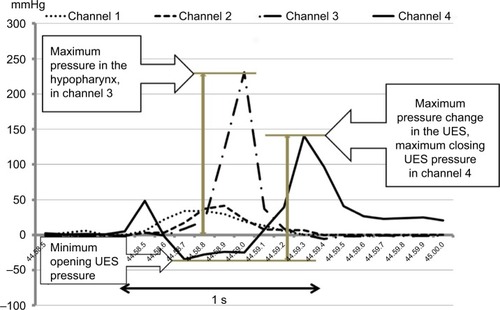
Figure 3 VF images of typical cases in each group; pyriform sinus residue in a patient with DMD and DM1 (A and B, respectively) and supraglottic penetration in a patient with ALS (C).
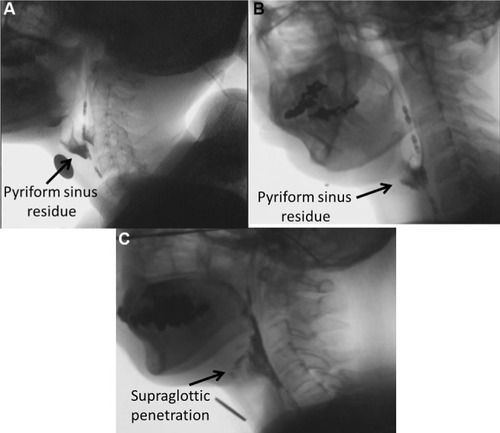
Table 2 Comparison of the three groups with regard to patient characteristics and swallowing pressures
Table 3 Comparison between the bulbar-onset group and the limb-onset group in the ALS group
Table 4 Correlations between age and swallowing pressures and among swallowing pressures in the three groups of patients
Table 5 Correlations between ALSFRS-R and swallowing pressures and among swallowing pressures in the ALS bulbar-onset and limb-onset groups