Figures & data
Figure 1 Areas of BMDJ and FDOJ.
Notes: The left panel shows a hollow cavity in areas 38–39 after scraping out the softened spongy bone marrow defect (BMDJ). The right panel shows a lump of fatty-degenerated bone marrow with typical yellowish coloring as a sign of fatty transformation (FDOJ).
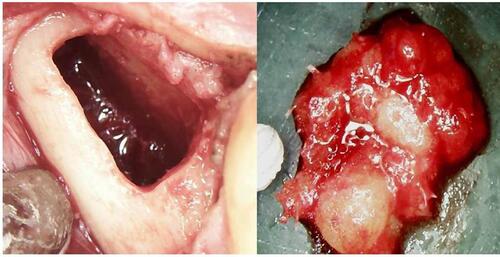
Figure 2 Excision of BMDJ and FDOJ.
Notes: The left panel shows a hollow cavity in areas 38–39 after scraping out the softened spongy bone of the BMDJ (yellow circle). The right panel shows a lump of fatty-degenerated bone marrow with transformed spongy bone nearly to liquidity (FDOJ).
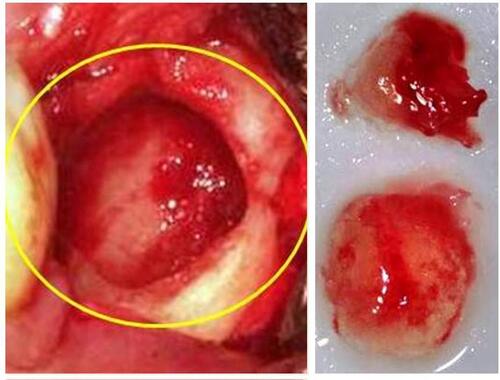
Figure 3 Comparison of cytokines in BMDJ/FDOJ versus normal cancellous bone.
Notes: Comparison of seven cytokines in MS patients (n=6) in BMDJ/FDOJ (red columns) and in normal cancellous bone (n=19) in pg/mL (blue columns) in bone samples obtained postoperatively. Singular R/C overexpression in BMDJ/FDOJ samples in MS patients (n=6) compared with healthy jawbone (n=19).
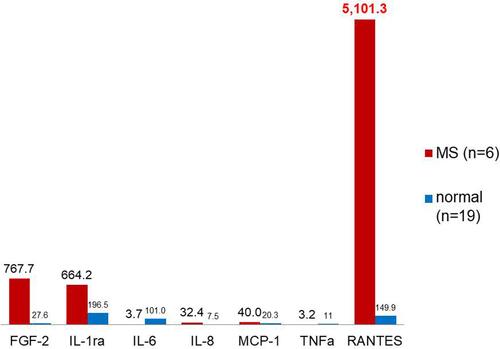
Figure 4 R/C overexpression in BMDJ/FDOJ.
Notes: MS patients (n=17; red column) compared to healthy jawbone (n=19; blue column).
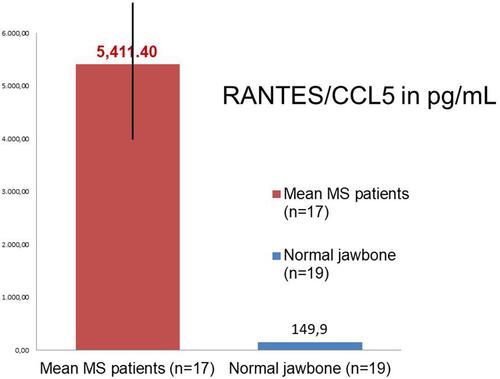
Figure 5 Histological findings from BMDJ/FDOJ-MS samples (n=17).
Notes: In only one case, typical inflammatory cells were found in BMDJ/FDOJ; 16 cases were free of inflammatory cells.
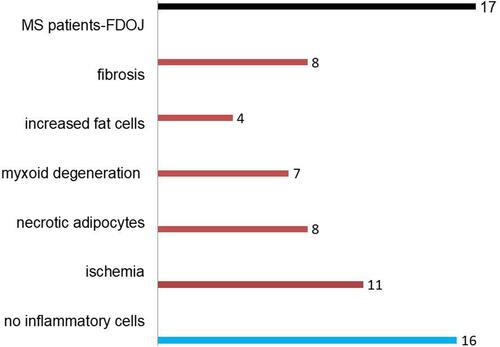
Figure 6 Comparison of cytokines in BMDJ/FDOJ in an MS patient versus healthy controls.
Notes: The columns show the comparison between the expression of seven cytokines in BMDJ/FDOJ region 38/39 (red columns) in a patient with MS to that of the control group with a healthy jawbone and without neurodegenerative diseases (n=19; blue columns). Upper-left panel: 2D-OPG X-ray diagnosis is entirely normal and does not show the osteolytic bone defects (outlined in the red circle).
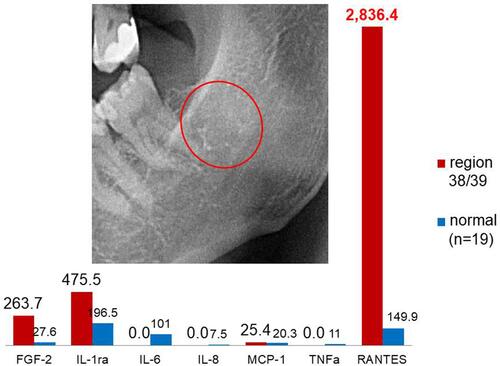
Figure 7 Comparison of the expression of seven cytokines in BMDJ/FDOJ in an MS patient versus the control group.
Notes: The columns show the comparison of the expression of seven cytokines in BMDJ/FDOJ region 38/39 (red columns) in a patient with MS to the control group with a healthy jawbone and without neurodegenerative diseases (n=19; blue columns). Upper-left panel: 2D-OPG (right) and 3D-DVT (left) X-ray diagnostics (CBCT) are entirely normal and do not show the osteolytic bone defects (outlined in red circles).
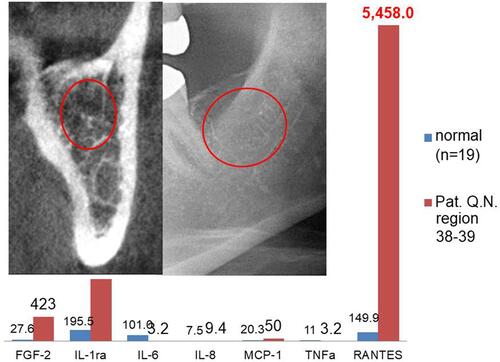
Figure 8 Comparison of R/C expression in the CSF and areas of FDOJ in MS patients.
Notes: All data are reported in pg/mL. Legend (from above): Light blue column = R/C in healthy jawbone in pg/mL; violet column = R/C in BMDJ/FDOJ areas of 17 MS patients in pg/mL; green column = R/C in CSF of MS patients in disease activity in pg/mL; red column = R/C in CSF of MS patients in pg/mL; dark blue column = R/C in the CSF of healthy control in pg/mL.
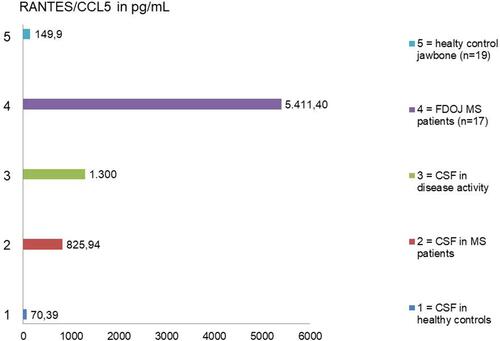
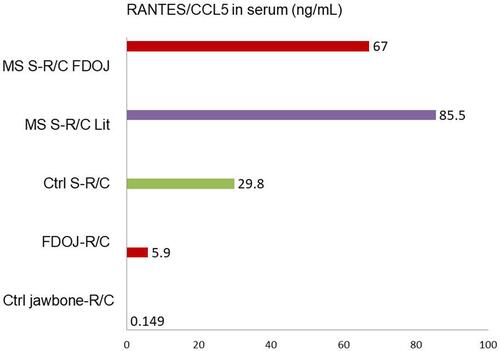
Figure 9 Comparison of R/C expression in serum in MS patients in the literature versus the cohort with areas of FDOJ.
Notes: All data are reported in ng/mL. Legend (from above): Red column = S-R/C in MS patients with BMDJ/FDOJ in pg/mL; violet column = S-R/C in MS patients in literature in pg/mL; green column = S-R/C in healthy control in pg/mL; red column = R/C in BMDJ/FDOJ in 17 MS patients in pg/mL; green column = R/C in jawbone in healthy control in pg/mL.