Figures & data
Table 1 Detailed Information on the Active Compounds of SZR
Figure 1 Venn diagram of the target genes for TS and SZR active compounds. TS has 2624 target genes, while SZR has 42 target genes. There are 30 overlapping target genes between the two sets.
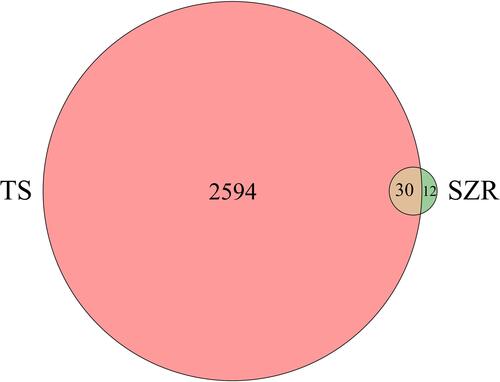
Figure 2 PPI network of the 30 overlapping target genes. Within a PPI network, each protein is represented as a node, and interactions are represented by the lines between the nodes. The number of lines linked to a given node is defined as the connectivity degree.
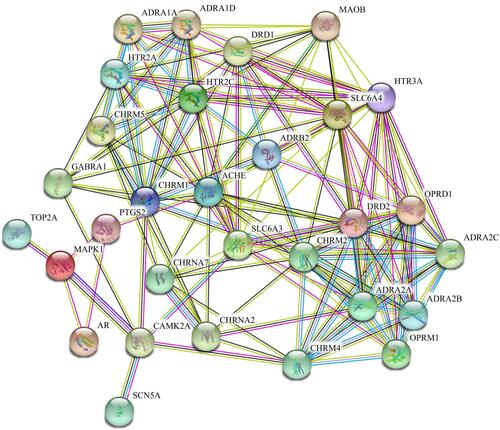
Figure 3 Hub nodes from the PPI network. AChE has the highest connectivity degree. Nodes that possess important biological functions usually have a high connectivity degree and are also named hub genes.
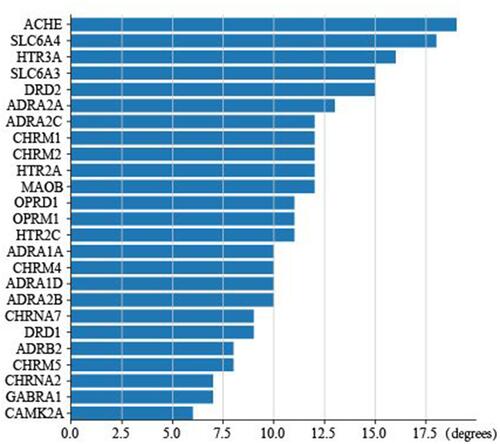
Figure 4 Network of SZR, compounds, target genes, and Tourette syndrome (TS). Red rectangle, TS; yellow diamond, SZR; yellow triangle, compounds; blue octagon, target genes.
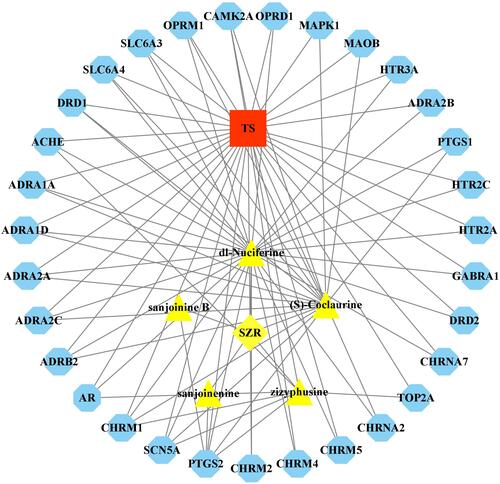
Figure 5 GO term enrichment analysis.
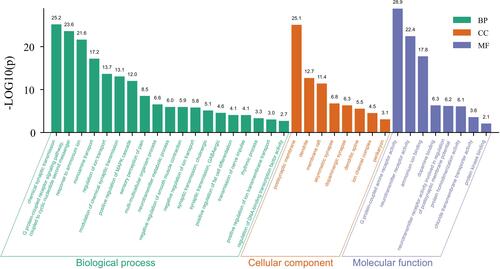
Figure 6 KEGG pathway enrichment analysis.
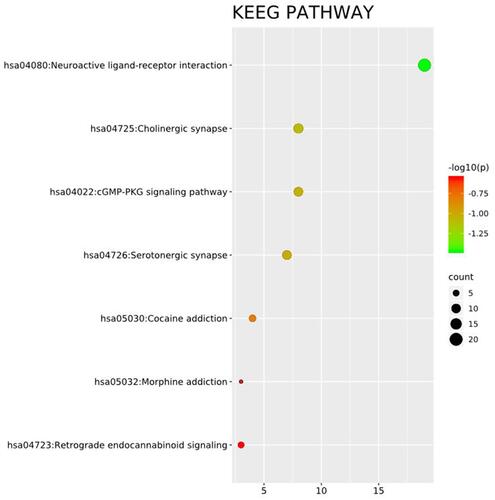
Figure 7 KEGG pathway enrichment analysis demonstrating the interactions among various pathways.
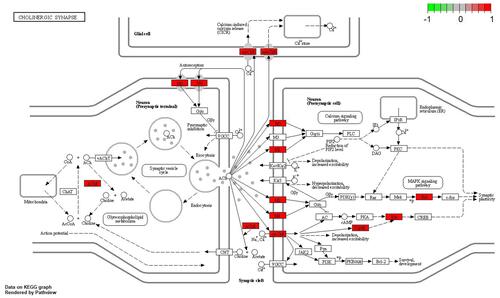
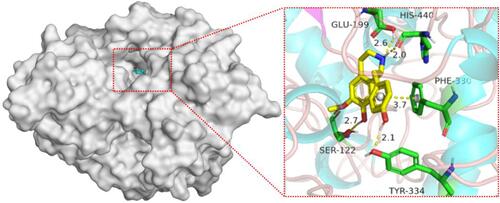
Table 2 AChE Docking Results for the Compounds of SZR
Figure 8 Binding pattern of (S)-coclaurine) and AChE protein.