Figures & data
Figure 1 An SOD1-G93A rat reaching with its right forelimb to press the operandum (its head is hidden in the cylinder as it drinks water from the dipper cup). The spatial arrangement of the window through which the rat reaches, and the dipper ensures use of only the right forelimb. The water dipper is raised when the force criterion is exceeded.
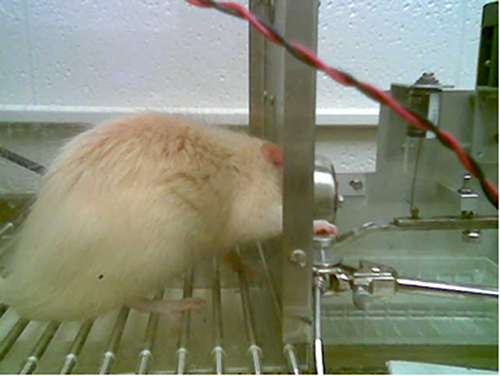
Figure 2 Raw force-time waveforms from a selected 30-s portions of an 8-min resistance training session. Force is on the ordinate and time is on the abscissa. The graph illustrates press-hold-release bouts at ~32 and ~54 seconds into the task. There were also two brief presses at ~48 and ~52 seconds into the task.
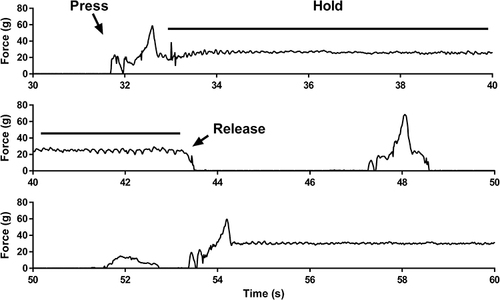
Figure 3 Body weight as a function of age (in weeks) for the wildtype (black circles, n=5) and SOD1-G93A (open circles, n=6) groups. Rats were trained to perform the task prior to week 13 and continued daily strength training through their 23rd week. ***Group × time interaction, p<0.001; *First time point at which groups differed significantly as determined by t-test.
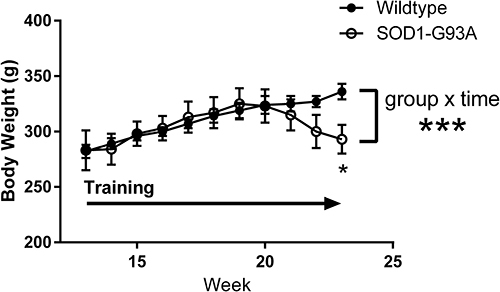
Figure 4 Time on task (A) and time integral of force (B) as a function of time (4 months, 5 months, final session) in wildtype (n=5; black circles) and SOD1-G93A rats (n=6 open circles). Time on task declined across the sessions. Although this was driven primarily by the SOD1-G93A group, neither the main effect for group nor the group by time interaction achieved statistical significance. Although time integral of force declined across time in the SOD1-G93A rats, this measure did not differ significantly between-groups, as a function of time, or in the group × time interaction. *Main effect for time, p<0.05.
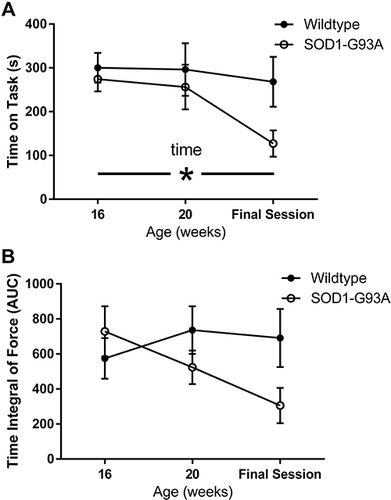
Figure 5 Mean force (A), integrated power in the 10–25 Hz band (B), and the ratio of 10–25 Hz power to force (C) as a function of group and time (n=5 WT; n=6 SOD1-G93A). Neither force nor 10–25 Hz power differed significantly as a function of group or time. The ratio of 10–25 Hz power to force did decline significantly as a function time. Although this was driven by the wildtype group, there was not a significant effect of group or group by time interaction. *Main effect for time, p<0.05.
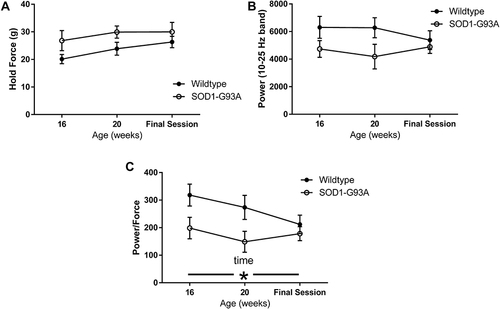
Figure 6 Strength training protected against NMJ denervation in biceps of SOD1-G93A rats. (A) Epi-fluorescence microscopy images of representative forelimb biceps NMJs from an SOD1-G93A rat (rows show 2 images per forelimb). NMJs were detected using antibodies against neurofilament and SV2 (nerve; green) and α-bungarotoxin (acetylcholine receptors; red). Images are for illustration. Quantification was done by focusing through the 3D structure of the NMJ as described in the Methods. Notice the overlap of the nerve and receptor in the trained muscle (indicated full innervation) and the lack of overlap in the untrained muscle (the nerve has died back, and the receptor is denervated). (B) Wildtype rats exhibited greater NMJ innervation than SOD1-G93A rats. Resistance training had little effect on NMJ innervation in the right (trained) vs left (untrained) biceps in the wildtype rats (n=5) but protected against denervation in the trained biceps in the SOD1-G93A rats (n=6). *Group × side interaction, p=0.05.
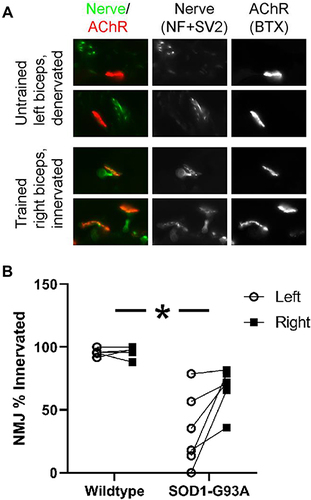
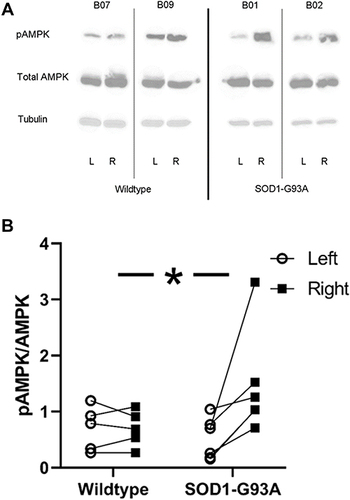
Figure 7 Strength training resulted in greater pAMPK levels in triceps muscles of SOD1-G93A rats, but not wildtype rats. (A) Representative blots showing pAMPK, total AMPK, and tubulin levels in left (L; untrained) and right (R; trained) limbs of two wildtype (rat B07 and B08) and two SOD1-G93A rats (rat B01 and rat B02). (B) Trained muscles in SOD1-G93A rats exhibited greater activated AMPK (pAMPK). *Group × side interaction, p<0.05.