Figures & data
Figure 1 Influence of leptin on the levels of Aβ1-40 (Left) and Aβ1-42 (Right) in the adult + leptin group, adult + saline group, aged + leptin group and aged + saline group.
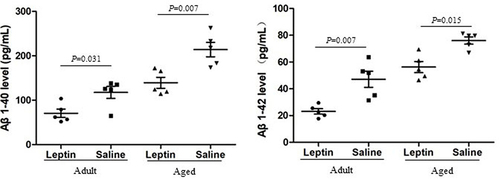
Figure 2 Western blotting analysis of synaptophysin expression in the adult + leptin group, adult + saline group, aged + leptin group and aged + saline group.
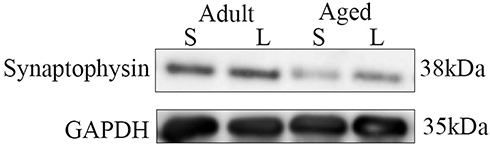
Figure 3 Semi-quantitative analysis of synaptophysin expression in the adult + leptin group, adult + saline group, aged + leptin group and aged + saline group.
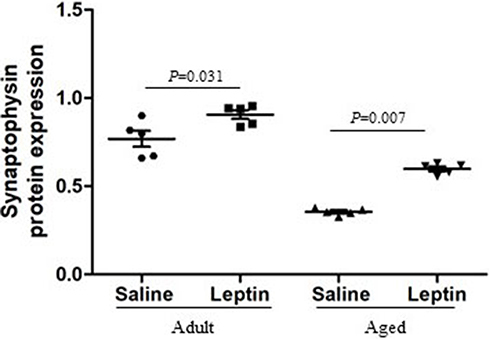
Figure 4 Leptin increased microglial cell number in the hippocampus of adult mice, but not aged mice. (A–D) Representative images of Iba-1+ cells, in the hippocampus sections of the mice. (E–G) Quantitative analysis of Iba-1+ stained cells.
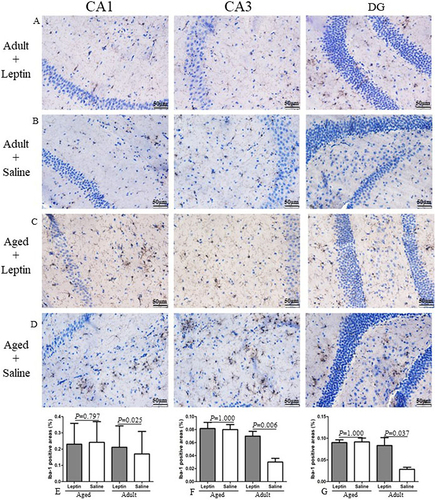
Figure 5 Influence of leptin on the levels of IL-1β (Left), IL-6 (Right) in the adult + leptin group, adult + saline group, aged + leptin group and aged + saline group.
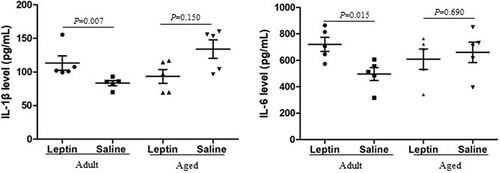
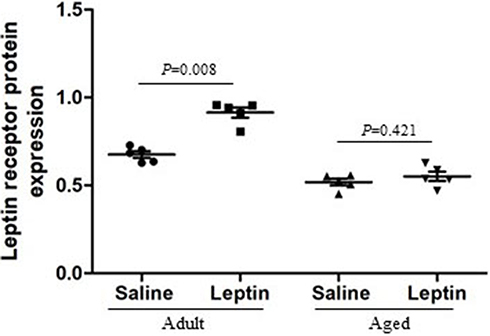
Figure 6 Western blotting analysis of leptin receptor expression in the adult + leptin group, adult + saline group, aged + leptin group and aged + saline group.
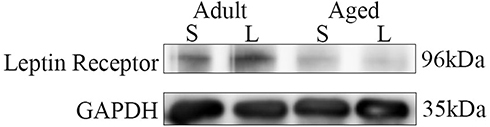
Figure 7 Semi-quantitative analysis of leptin receptor expression in the adult + leptin group, adult + saline group, aged + leptin group and aged + saline group.