
Figures & data
Table 1 Clinical Characteristics of the AD Patients and ND Subjects
Figure 1 Exosome Identification (A). The identification of serum exosomes by transmission electron microscope.The exosome appear as round structures enclosed by double-leaflet membranes, with a diameter of approximately 30–150nm (B). The identification of serum exosomes by Nanoparticle Tracking Analysis.The particle size of exosome is 96.5±33.1nm, with an original concentration of 2.0 × 10¹¹Particles/mL (C). The identification of exosomes specific proteins by Western blot.CD63 is a transmembrane protein with a molecular weight of around 35kDa. TSG101 belongs to the ESCRT related protein with a molecular weight of around 45kDa.
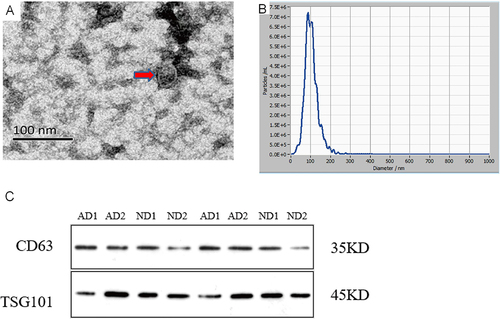
Table 2 miRNAs Showing Differential Expression
Figure 2 The difference of exosomal microRNA level different age group of ND with t-tests or among EOAD, LOAD and ND are compared with nonparametric tests (Kruskal–Wallis test). (A) There are no significant difference in age<65 years old group and age ≥65 years old group of exosomal microRNA (B). Comparing with ND, the expression of miR-125b-1-3p in serum exosomes of LOAD is upregulated significantly(p < 0.001). (C) There are no significant difference of miR-193a-5p among EOAD, LOAD and ND. (D) Comparing with ND, the expression of miR-378a-3p of EOAD and LOAD are upregulated significantly(p < 0.001 and p = 0.013, respectively).(E)Comparing with EOAD, the expression of miR-378i of LOAD and ND are downregulated significantly(p = 0.004 and p = 0.039, respectively) (F). Comparing with ND, the expression of miR-451a of LOAD is upregulated significantly(p = 0.001). The y-axis indicate microRNA expression levels by log10 change. *p < 0.05; **p < 0.01;***p < 0.001.
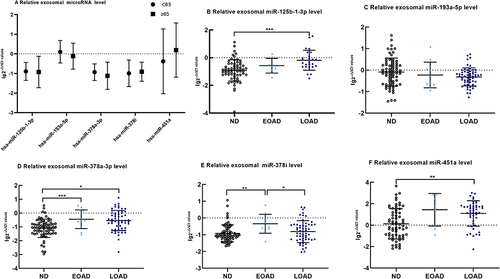
Figure 3 Exosomal microRNAs qRT-PCR (A) The difference of exosomal microRNA level between AD and ND is compared with nonparametric tests Mann–Whitney U-test. The y-axis indicates microRNA expression levels by log10 change. *p < 0.05,***p < 0.001. The expression of miR-125b-1-3p in serum exosomes of AD is upregulated significantly(p < 0.001);The exosomal miR-193a-5p of AD is downregulated significantly comparing with ND(p=0.020); The expression of miR-378a-3p in serum exosomes of AD is upregulated significantly(p < 0.001); Comparing with ND, the expression of exosomal miR-378i of AD is downregulated significantly(p = 0.042);The expression of miR-451a in exosomes of AD is upregulated significantly (p< 0.001) (B). The receiver operating characteristic(ROC) curve of serum exosomal miR-125b-1-3p. Area Under the Curve(AUC) of miR-125b-1-3p is 0.765 to distinguish AD from normal with a sensitivity and specificity of 82.1% and 67.7% (C). The ROC curve of serum exosomal miR-451a. AUC of miR-451a is 0.728 to distinguish AD from ND with a sensitivity and specificity of 67.9% and 72.6%,respectively.
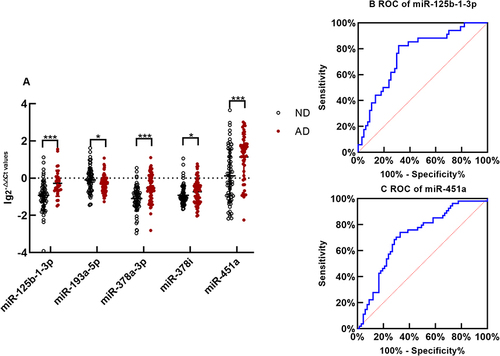
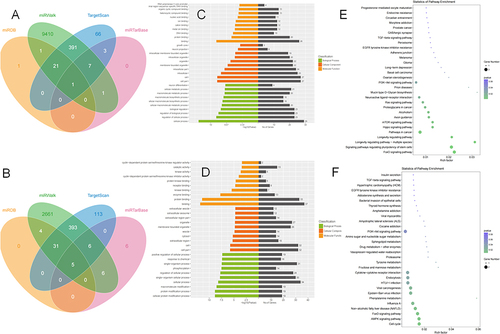
Figure 4 Prediction of MiRNA Target Genes (A and B).The venn of target genes of miR-125b-1-3p and miR-451a (C and D) Gene Ontology of miR-125b-1-3p’s and miR-451a’s candidate genes (E and F) Kyoto Encyclopedia of Genes and Genomes pathway of miR-125b-1-3p’s and miR-451a’s candidate genes.
Data Sharing Statement
The data presented in this study are available on request from the corresponding author. The data are not publicly available due to containing information that could compromise the privacy of research participants.