Figures & data
Table 1 Study diet developed by T Wahls
Table 2 Demographics and baseline characteristics of the subjects in the main study
Figure 1 Flowchart of the screening, enrollment, and follow-up of participants in the study.
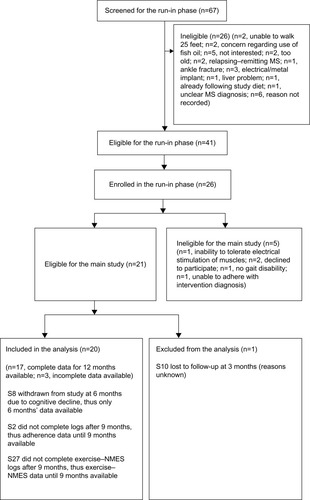
Figure 2 Subject’s nine-item Fatigue Severity Scale scores during the study.
Abbreviations: B, baseline; 3M, 3 months; 6M, 6 months; 9M, 9 months; 12M, 12 months.
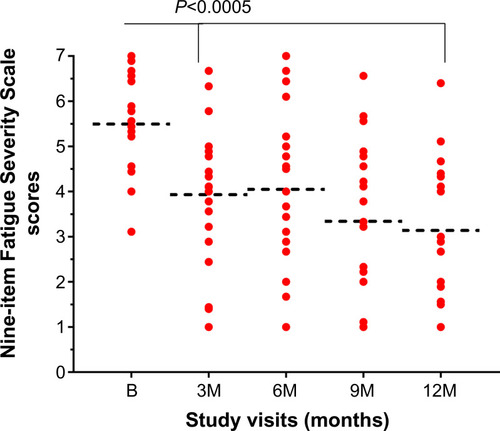
Figure 3 SF-36 energy, SF-36 general health and FSS-9 scores during the study, and correlation of mean SF-36 energy and mean SF-36 general health scores with mean FSS-9 scores at different time-points during the study.
Abbreviations: B, baseline; 3M, 3 months; 6M, 6 months; 9M, 9 months; 12M, 12 months; SF-36, Short Form-36; FSS-9, nine-item Fatigue Severity Scale; SE, standard error.
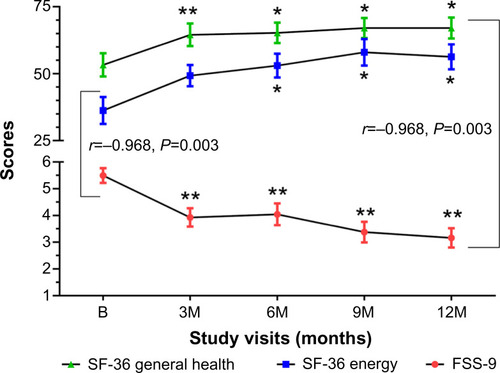
Figure 4 Comparison of good- and fair-responders’ dosage of (A) average massage duration, (B) average duration of stretch per muscle, (C) average duration of meditation per day and (D) average exercise-NMES adherence during 12 months.
Abbreviation: NMES, neuromuscular electrical stimulation.
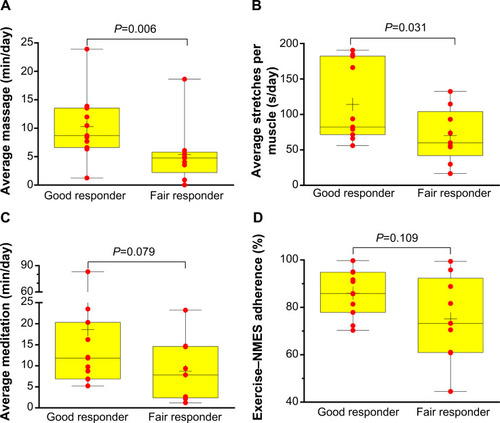
Figure 5 Correlations between changes in FSS-9 scores and (A) duration since MS diagnosis, (B) baseline PDDS scale scores, (C) baseline EDSS scores.
Abbreviations: EDSS, Expanded Disability Status Scale; MS, multiple sclerosis; PDDS, Patient Determined Disease Steps; FSS-9, nine-item Fatigue Severity Scale.
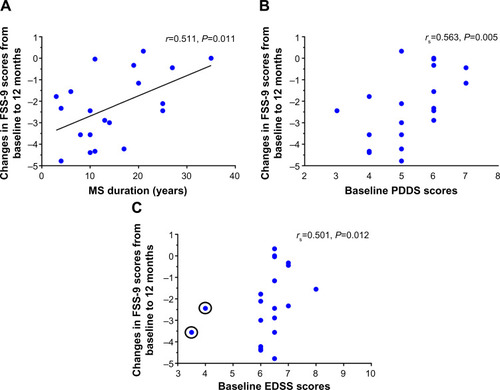
Table S1 List of exercises and the muscle group stimulated during the particular exercise
Figure S1 Subject’s Performance Scales-fatigue scores during the study.
Abbreviations: B, baseline; 3M, 3 months; 6M, 6 months; 9M, 9 months; 12M, 12 months.
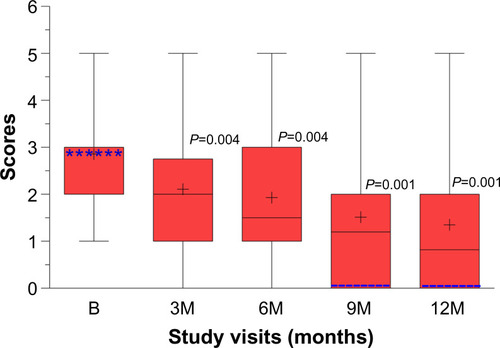
Figure S2 Health related quality of life scores: (A) SF-36 physical functioning, (B) role physical, (C) bodily pain and (D) social function scores during the study.
Abbreviations: B, baseline; 3M, 3 months; 6M, 6 months; 9M, 9 months; 12M, 12 months, SF-36, Short Form-36.
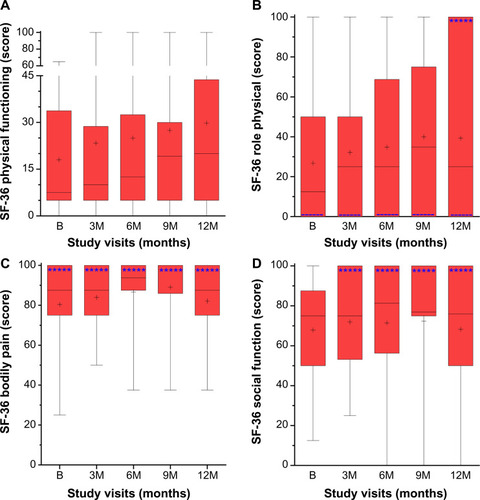
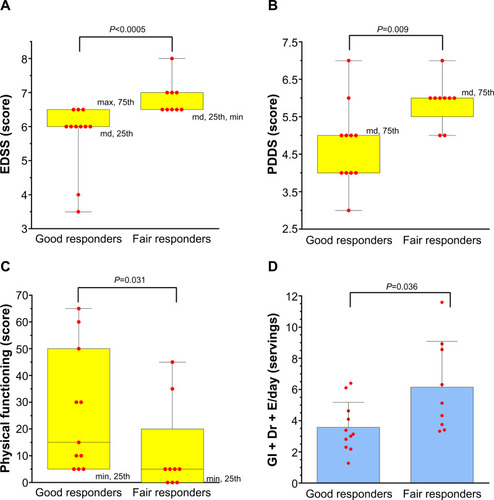
Figure S3 Comparison of baseline characteristics of good- and fair-responders in terms of (A) EDSS scores, (B) PDDS scores, (C) Sf-36 physical functioning scores and (D) mean daily serving of Gl + D + E.
Abbreviations: EDSS, Expanded Disability Status Scale; Gl + Dr + E, gluten-containing grains + dairy products + eggs; max, maximum; md, median; min, minimum; PDDS, Patient Determined Disease Steps; SD, standard deviation.