
Figures & data
Figure 1 Diagram representing the anatomy of the orbital apex.
Notes: Adapted from Hacking C. Orbital apex (diagram). © 2017 Craig Hacking; CC-BY-SA-NC. Radiopedia.org. Available from: https://radiopaedia.org/cases/orbital-apex-diagram-1?lang=us. Accessed 28 November 2019.Citation31
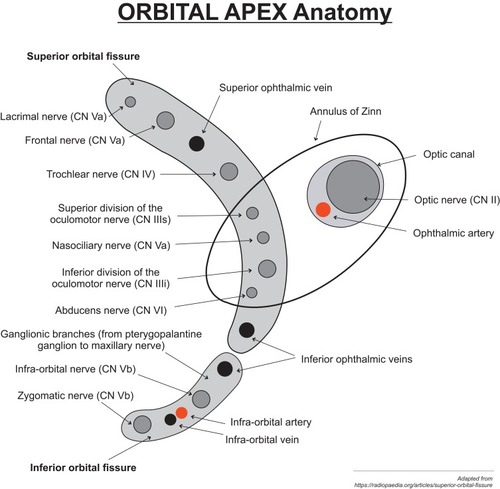
Table 1 Etiology of Orbital Apex Syndrome syndrome
Figure 2 Nine gaze photo of a patient with orbital apex syndrome showing limitation of motility in all gazes in the left eye. This patient underwent a complete blood count and distribution, cerebrospinal fluid examination for cytology and microbiological work up, Mantoux test and serum ACE levels along with an MRI Brain and orbits with contrast. Since all the blood investigations were normal, she was diagnosed as Tolosa Hunt Syndrome.
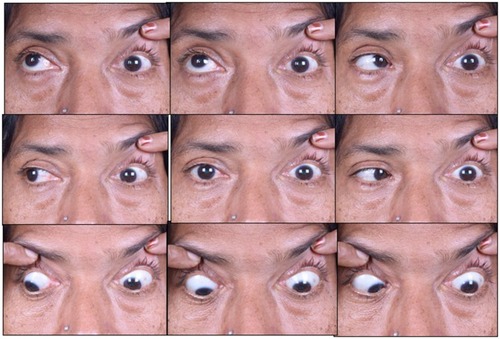
Figure 3 (A and B) MRI brain and orbits with gadolinium contrast of the same patient mentioned in . The yellow circle delineates a homogenously enhancing lesion extending from the left orbital apex to the cavernous sinus.
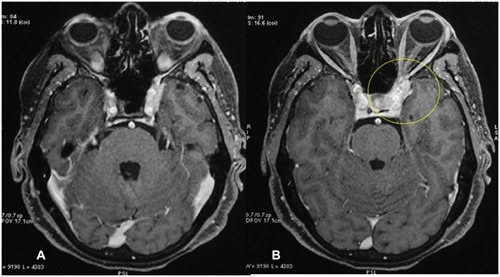
Figure 4 (A) MRI orbit T2 weighted image (coronal section) shows a hyperintense lesion extending from the left sphenoid sinus (yellow arrow) into the left orbital apex compressing the optic nerve (green arrow). (B) MRI orbit T2 weighted image (coronal section) of the same patient post sphenoid sinus and optic nerve decompression.
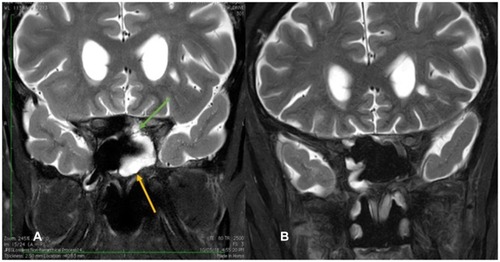
Table 2 Depicts a Simple Algorithm to Localize Lesions in and Around the Orbital Apex