Figures & data
Figure 1 Gaze positions as a function of time in patients without nystagmus (A), with FMNS (B), and with nystagmus but not FMNS (C) as they fixated on a target monocularly with the amblyopic (top) and fellow (bottom) eyes. Note the large drift amplitudes in the subject without nystagmus. FMNS can be distinguished by the reversal in slow phase direction that occurs when the eye under cover is changed. Red - right horizontal, magenta – right vertical, blue – left horizontal, cyan – left vertical. Rightward and upward movements correspond to the positive vertical axis.
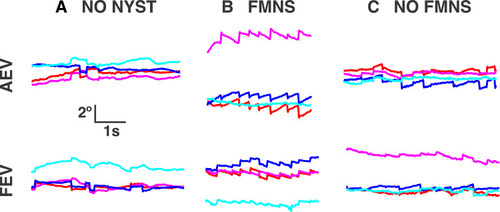
Table 1 Cohort Composition
Table 2 Acuity Measurements by Type and Fem Characteristics
Table 3 Grating Acuity Miss Values by Astigmatism Type and Orientation
Figure 2 Mean and standard error of the mean for amblyopic eye log percentage Michelson contrast thresholds measured at 4 (black bars) and 14 (white bars) cycles per degree for subjects grouped by clinical type (A) and FEM characteristic (B). Single asterisks and daggers denote significant (p<0.05) differences relative to the control and mixed/strabismic groups, respectively, after controlling for AE grating acuity and applying Bonferroni correction.
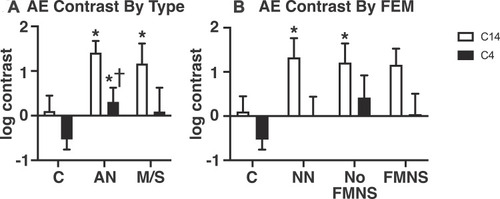
Figure 3 Mean and standard error of the mean for fellow eye log percentage Michelson contrast thresholds measured at 4 (black bars) and 14 (white bars) cycles per degree for subjects grouped by clinical type (A) and FEM characteristics (B). Single asterisks denote significant (p<0.05) differences relative to the control group after controlling for FE grating acuity and applying Bonferroni correction.
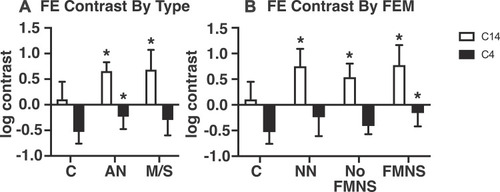
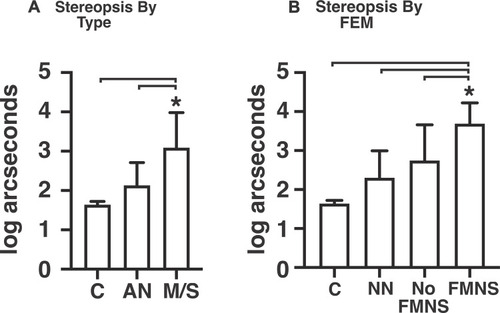
Figure 4 Mean and standard error of the mean for stereopsis in log arcseconds grouped by type (A) and FEM characteristic (B). Single asterisks denote statistically significant (p<0.05) differences compared to the groups indicated by the brackets after controlling for AE grating acuity and applying Bonferroni correction.