Figures & data
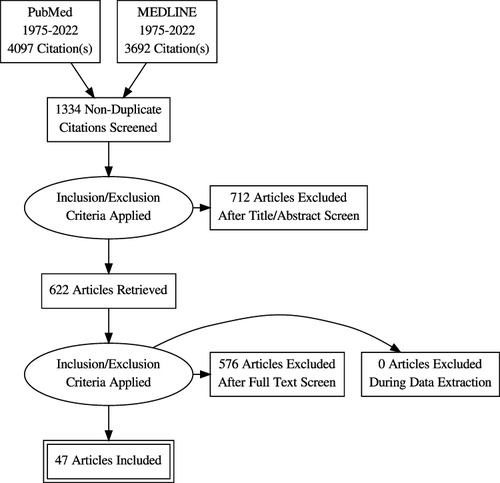
Figure 1 Schematic representation of trans-synaptic degeneration. Retinal ganglion cell atrophy leads to anterograde trans-synaptic degeneration along the optic nerve, optic tract, LGN, and optic radiation. Emerging theories suggest degeneration beyond these pathways, but this remains controversial.
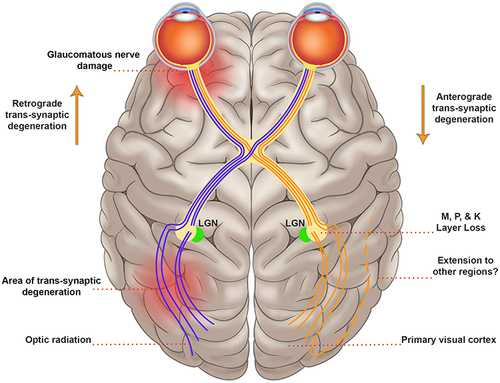
Figure 2 Schematic representation of trans-synaptic degeneration on a cellular scale.
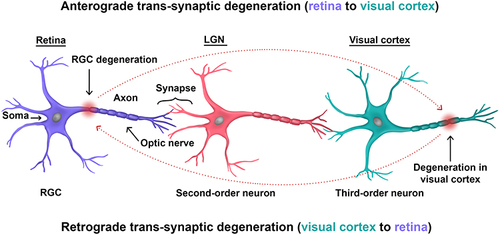
Figure 3 Efferent control of eye movement. (A) anterior (B) axial and (C) sagittal views of the anatomical origins of cranial nerves III, IV, and VI.
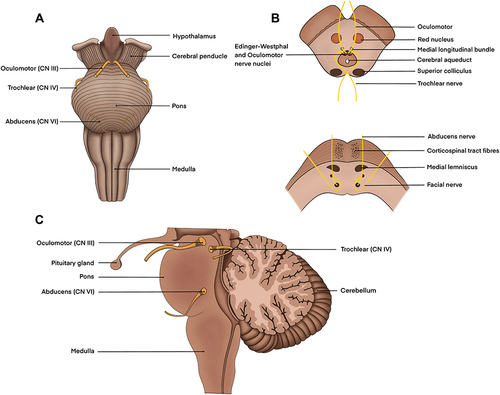
Figure 4 Depiction of a prosacadde, anti-saccade, and fixation task.
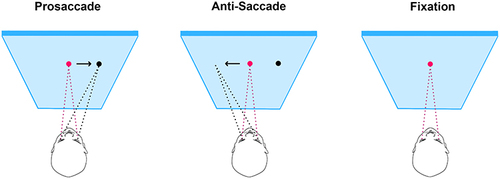
Figure 5 Forest plot of saccade latency as measured in milliseconds.Citation62–67,Citation171
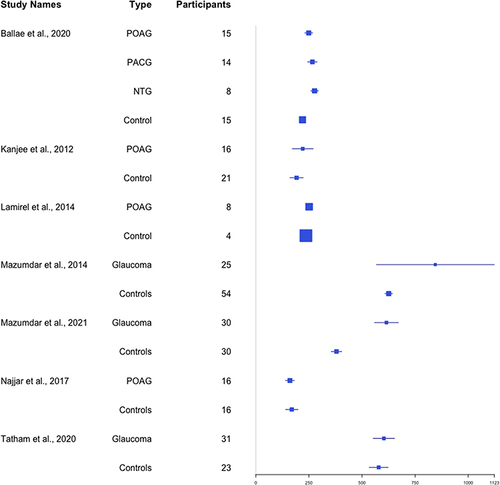
Figure 6 Forest plot of peak saccade velocity data as measured by degrees/ second. Ballae et alCitation63 report their velocities as degrees/ millisecond which is interpreted by the authors as a misprint.Citation62,Citation63,Citation66
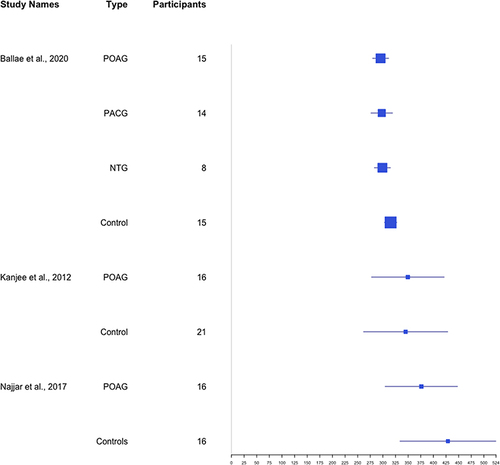
Figure 7 Forest plot of fixation task data as measured by log-BCEA 95%. *Longhin et alCitation98 did not report their range of BCEA values which provides a misleading effect size in this figure.Citation86,Citation98,Citation99
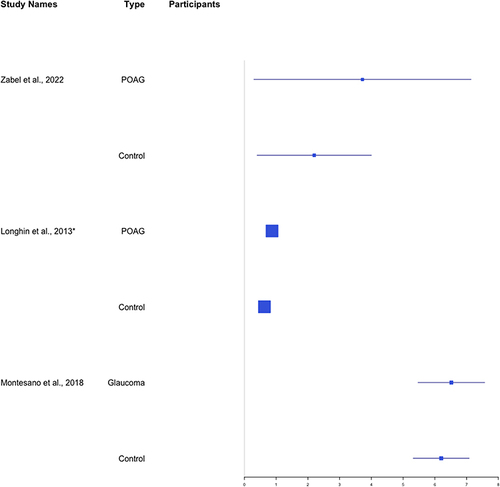
Table 1 Studies on Isolated Saccade and Anti-Saccade Tasks in Patients with Glaucoma
Table 2 Studies on Isolated Fixation Tasks in Patients with Glaucoma
Table 3 Studies on Optokinetic Nystagmus in Patients with Glaucoma
Table 4 Studies on Eye Movements During Reading in Patients with Glaucoma
Figure 8 Summary of key points.
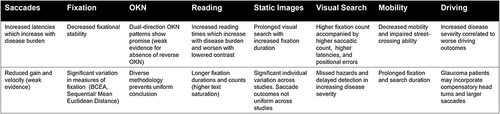
Table 5 Studies on Eye Movements During Viewing of, and Searching for Targets Within, Static Images in Patients with Glaucoma
Table 6 Studies on Eye Movement During Viewing and Searching for Targets Within Moving Images in Patients with Glaucoma
Table 7 Studies on Eye Movements While Walking Through an Environment in Patients with Glaucoma
Table 8 Studies on Eye Movements During Driving in Patients with Glaucoma
Table 9 Keywords Included in Search Strategy
Figure 9 Study selection for review according to PRISMA criteria described in Moher et al 2009.Citation181