
Figures & data
Table 1 The Fundus Examinations
Figure 1 The ONSD of the right eye on admission (before surgical intervention) (5.89 mm).
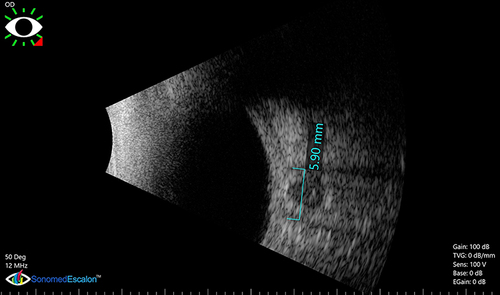
Figure 2 The follow-up of ONSD after 48hs of surgical interventions of the previous patient is shown in (4.86 mm).
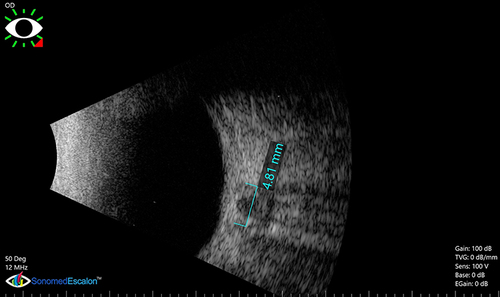
Figure 3 The correlation between Glasgow coma scale and ONSD on admission. Scattered dot diagram (Blue circles refer to cases).
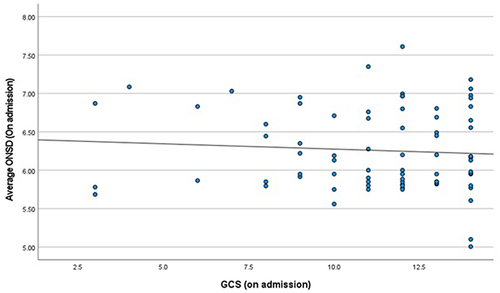
Figure 4 The correlation between Glasgow coma scale and ONSD after 48hs. Scattered dot diagram (Blue circles refer to cases).
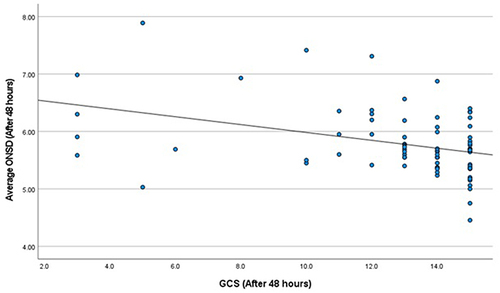
Table 2 The Relation Between ONSD and CT on Admission
Table 3 The Relation Between ONSD and CT Findings After 48 Hours
Table 4 The Fundoscopic Examination in Correlation to ONSD
Table 5 The Validity of ONSD
Figure 5 ROC curve for the validity of ONSD (cases vs controls).
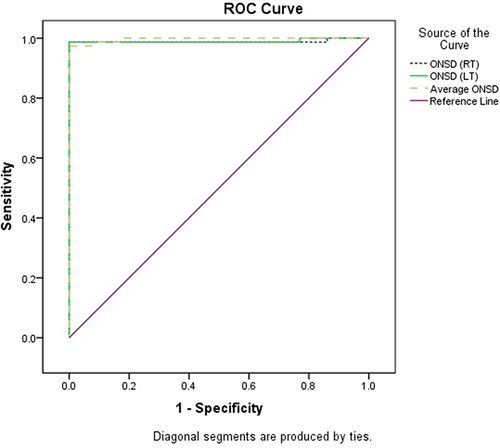
Figure 6 ROC curve for the validity of ONSD patients with the evidence of the radiological finding of increased ICP.
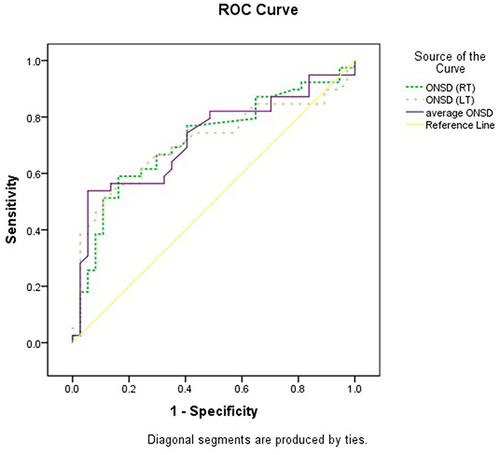
Table 6 The Mortality Rate in Correlation to ONSD