Figures & data
Table 1 Participants’ Demographic and Statistical Comparison
Figure 1 Stages of the LGN edge enhancement process in four example participants: Two participants were from the RPE65 patient group (CH18 and CH47) and two were from sighted control group (SC30 and SC31). (A) Utilizing each subjects’ 3D MPRAGE T1 weighted images and the ITK-SNAP software the LGN is identified (red box) and its center coordinate is recorded on both the left and right hemispheres. (B) The 3D whole brain images and the center coordinates were submitted to the c3d software (available also through the ITK-SNAP download) and a 22x22x22 voxel ROI was extracted containing LGN in its entirety. Note that the LGN is hardly visualized for all unenhanced images in all four example cases. (C) The edge enhanced LGN containing ROIs demonstrating improved visibility of the LGN as compared to the unenhanced images shown in column “B”. (D) Using the edge enhanced images shown in column “C” LGN can be clearly demarcated from the surrounding structures and can easily be manually outlined resulting to a more accurate morphometry.
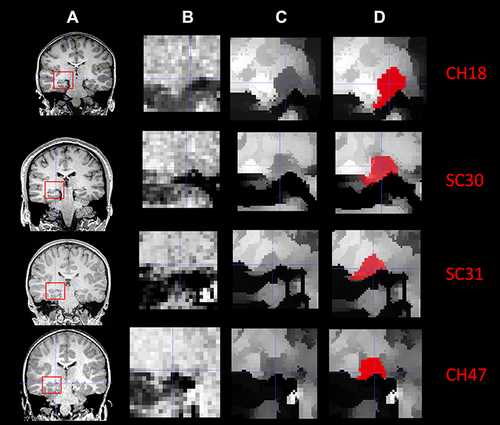
Table 2 Agreement Between Two Raters for the Measurements of the Left and Right LGN in a Group of RPE65 Patients at Baseline and 1YR After Retinal Gene Therapy
Figure 2 Box Whisker plots of the left and right LGNs for 10 RPE65 patients and 11 sighted controls (8/11 returned for one year follow up). Comparison of the center, spread of group and the median for the left and right LGN volumes shows a significant increase in LGN volume for the left (p<0.0001) and right (p<0.00002) among the RPE65 patients one year after their bilateral retinal gene therapy. Comparison of the left and right LGN volumes from baseline and one-year measurements in sighted controls showed no significant changes in the LGN volume over time.
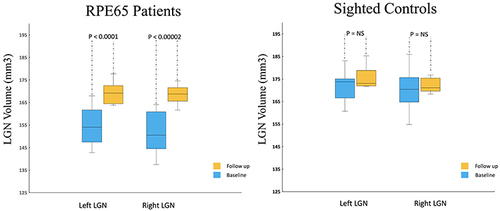
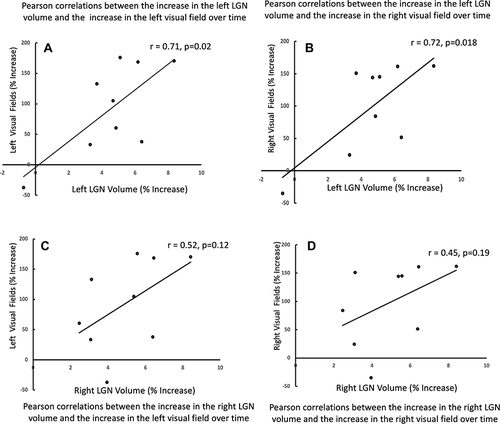
Figure 3 Correlations between the LGN volumes and patients’ Goldmann visual field measurements. To demonstrate the clinical significance of the increase in LGN volume, one year after retinal intervention, the percent incremental increase in the LGN volume (from baseline to 1YR post intervention) was correlated with the clinical visual test results of the RPE65 patients. As shown in (A and B) respectively, significant positive correlations were observed between the percent left LGN volume increase and the incremental increase in the left and right GVF measures (from baseline to 1 YR follow up). As shown in (C and D), the Pearson correlations between the percent incremental increase in the right LGN and the percent incremental increase of the left and right GVF were not significant. While the positive direction of the correlations between both the left and right LGNs and the left and right GVFs is encouraging, the strong laterality between the two correlations for changes in the left and right LGNs were not expected, as all the RPE65 patients received bilateral retinal interventions.