Figures & data
Figure 1 Category 1 iWellness™ OU report for subject J749, with a normal healthy retina and ganglion cell complex.
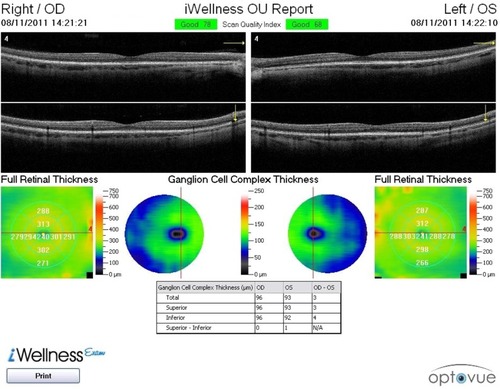
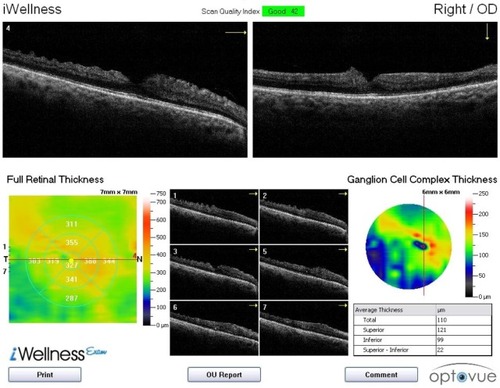
Figure 2 Category 2 iWellnessExam™ report OS for subject J893.
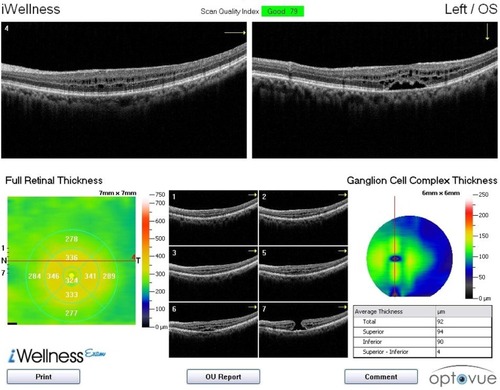
Figure 3 Category 2 iWellness™ OU report for subject J893.
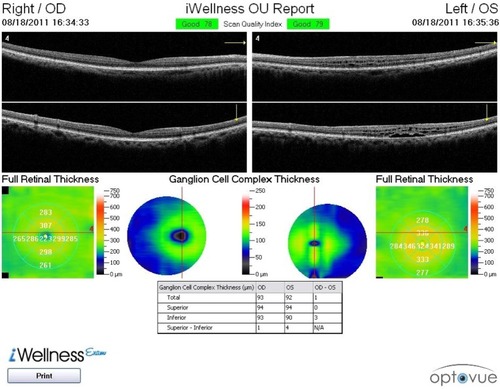
Figure 4 Category 3 iWellness™ OU report for subject J835.
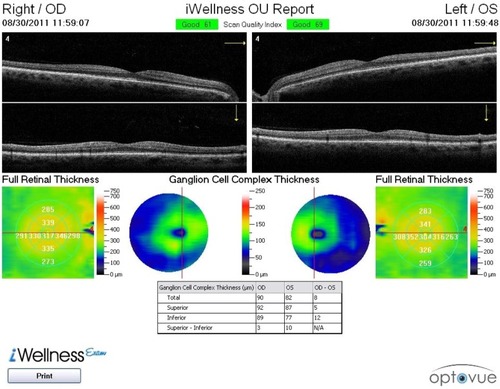
Figure 5 Category 3 iWellness™ report OS for subject J835.
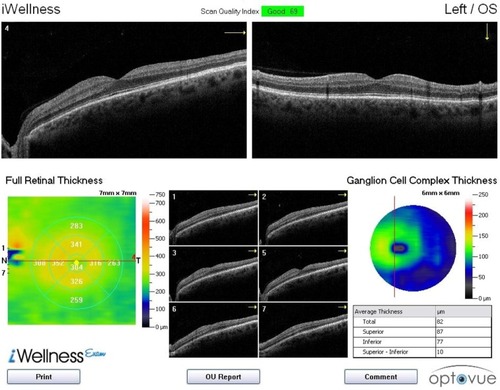
Figure 6 Category 4, iWellness™ OU report of subject J899.
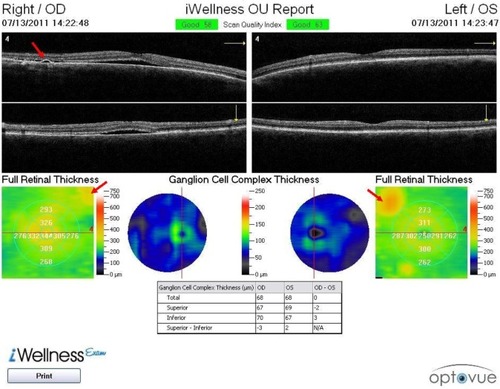
Table 1 Subject demographics by gender, ethnicity, and age
Table 2 iWellnessExam sensitivity and specificity, on expert review
Table 3 iVue iWellnessExam receiver operator characteristic on expert review
Table 4 Pathologies encountered
Table 5 Accuracy in the identification of both disease conditions, on expert review
Figure 7 Ganglion cell complex measurement reflects a subset of cells different to those used for the peripapillary retinal nerve fiber layer (RNFL) assessment.
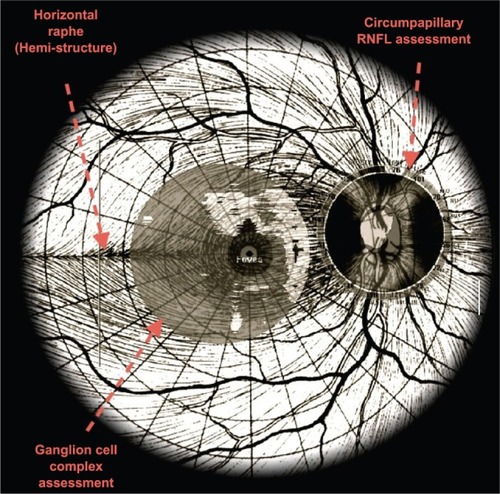
Figure 8 Category 2 subject (J728) with severe retinal distortion, interfering with retinal segmentation and ganglion cell complex thickness map and measurements.
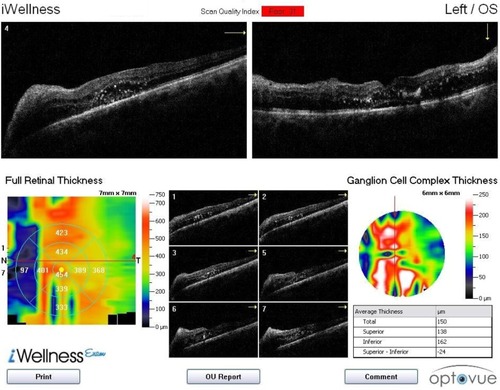
Figure 9 Category 2 subject (J911) with an epiretinal membrane and vitreomacular traction.