Figures & data
Figure 1 Rabies virus injections in macaque monkey primary visual cortex.
Abbreviations: CalcS, calcarine sulcus; CS, central sulcus; HM, horizontal meridian; IOS, inferior occipital sulcus; IPS, intraparietal sulcus; LatS, lateral sulcus; LuS, lunate sulcus; STS, superior temporal sulcus; V1, primary visual cortex; V2, secondary visual cortex; VM, vertical meridian; WM, white matter.
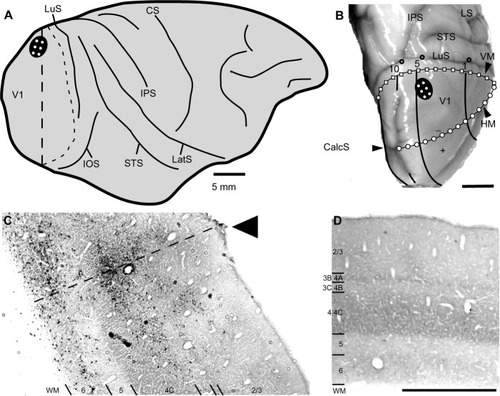
Figure 2 The distribution of rabies-infected neurons in two coronal sections of V1 of the right hemisphere.
Abbreviations: CalcS, calcarine sulcus; V1, primary visual cortex; WM, white matter.
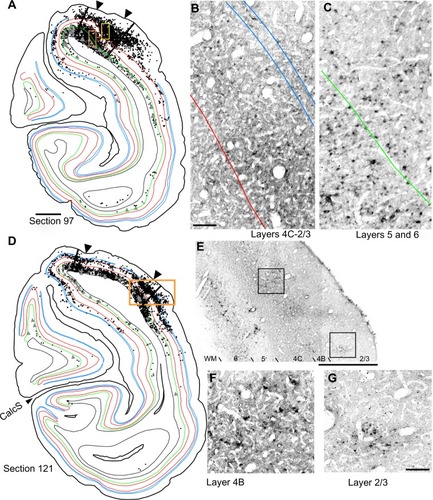
Figure 3 The distribution of rabies-infected neurons in a single cross-section of V1 of the right hemisphere.
Abbreviations: V1, primary visual cortex; WM, white matter.
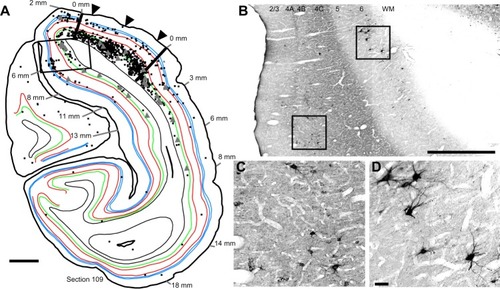
Figure 4 Serial reconstructions show the pattern of mono- and disynaptically connected neurons in visual cortex following rabies virus injections in V1.
Abbreviations: CalcS, calcarine sulcus; IOS, inferior occipital sulcus; IPS, intraparietal sulcus; LuS, lunate sulcus; STS, superior temporal sulcus; V1, primary visual cortex.
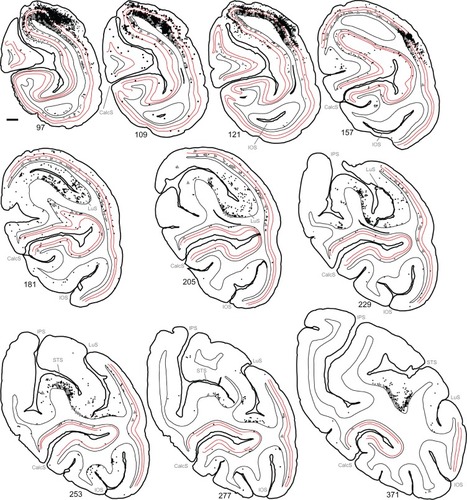
Figure 5 The numbers of retrogradely infected neurons found across several millimeters of the opercular surface of primary visual cortex.
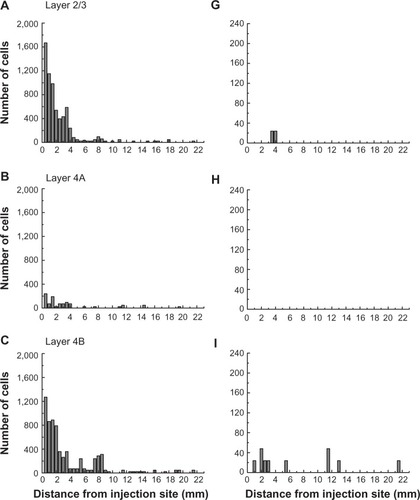
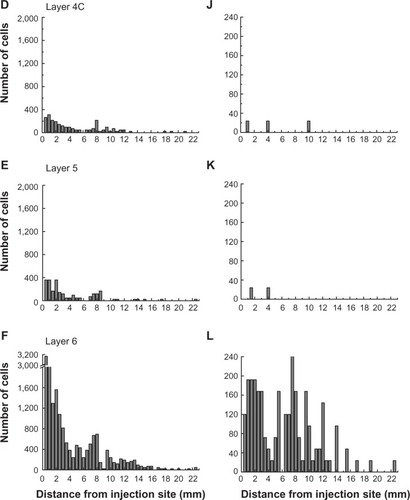
Figure 6 The numbers of retrogradely infected V1 neurons present in the calcarine sulcus.
Abbreviation: VI, primary visual cortex.
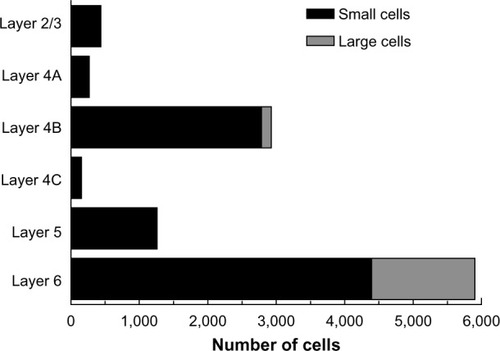
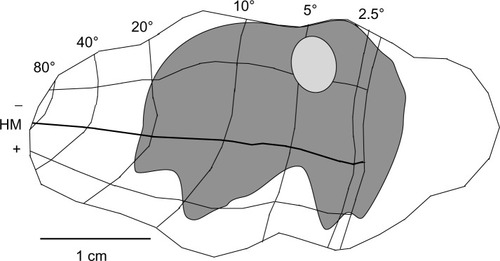
Figure 7 The region of visual space covered by the very-long-range disynaptic connections is shown on an unfolded, two-dimensional view of the V1 surface.
Abbreviations: HM, horizontal meridian; V1, primary visual cortex.