
Figures & data
Figure 1 Representation of the ear from the outer ear (A) to the middle ear (B) to the inner ear (C).
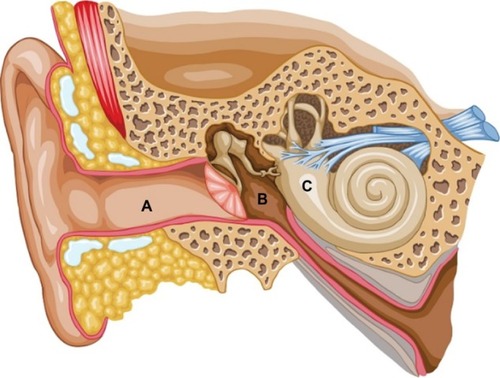
Figure 2 Representation of the two divisions of the inner ear.
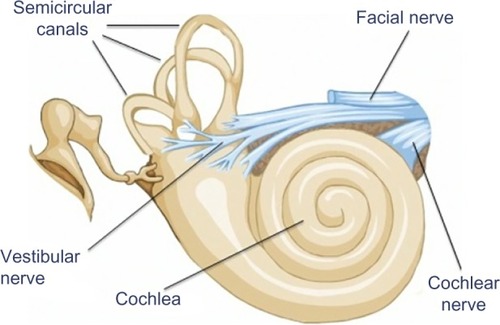
Figure 3 Representation of the endolymph (pink), which is the fluid contained in the membranous labyrinth of the inner ear and has a higher level of potassium than sodium.
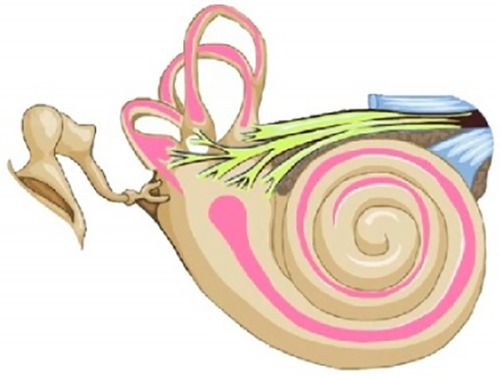
Figure 4 Representation of the three semicircular canals that detect angular head accelerations and the two otolith organs (utricle and saccule) that detect linear head accelerations.
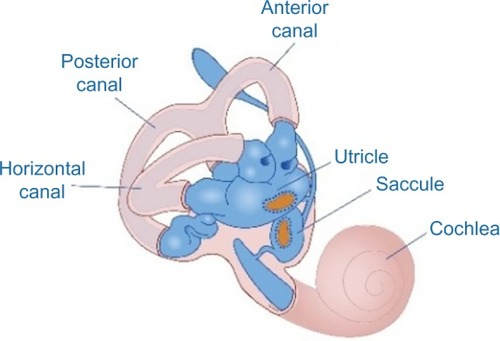
Figure 5 The bottom image represents orientation of hair cells within the utricle when the head is upright.
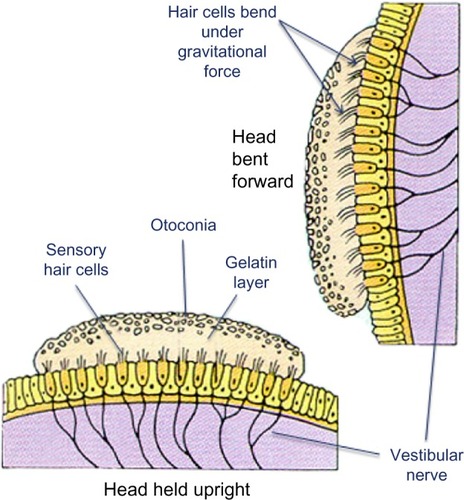
Figure 6 Representation of dislodged otoconia in both the posterior and horizontal canal.
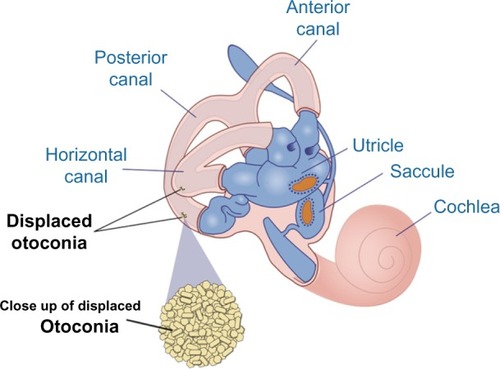
Figure 7 Representation of the endolymphatic flow.
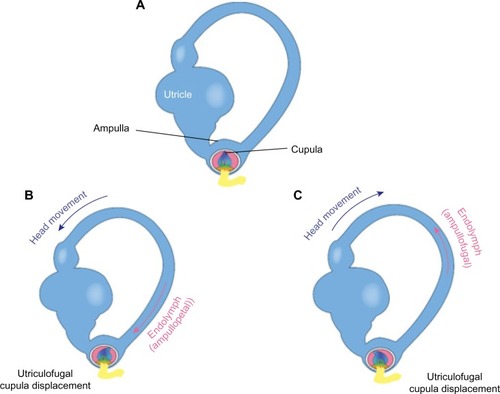
Table 1 Represents the excitatory and inhibitory connections of each SCC with the muscles of both eyes, which results in specific compensatory responses between the vestibular system and eye muscles
Table 2 Ewald’s three laws, which govern vestibular diagnostic testing
Table 3 Summary of vestibular disorders associated with head trauma and corresponding clinical presentation (adapted from Ernst).Citation10