Figures & data
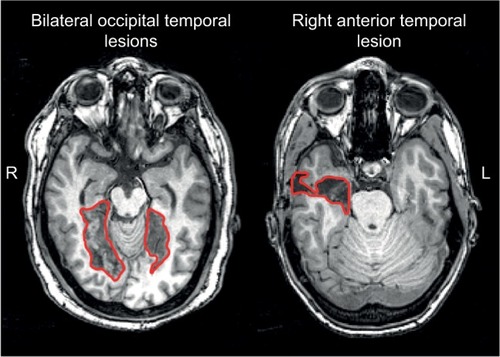
Figure 1 Adaption of the Bruce and Young model.
Notes: In the associative variant of prosopagnosia, face encoding is thought to be intact, represented by the ability to accurately discriminate between faces. However, faces are not seen as familiar suggesting a failure to activate face recognition units, subsequently affecting later stages in the face-processing stream. In the apperceptive variant, face encoding is thought to be impaired, affecting all later stages in the model when faces are the cue to identity. Gray arrows indicate the first stage of the model showing the greatest deficit in apperceptive and associative variants of prosopagnosia, respectively. © 1986 The British Psychological Society. Adapted from Bruce V, Young A. Understanding face recognition. Br J Psychol. 1986;77(Pt 3):305–327 with permission John Wiley and Sons.Citation17
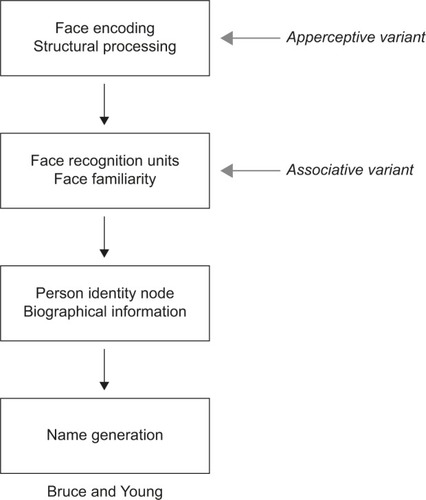
Table 1 Suggested inclusion and exclusion criteria for the diagnosis of acquired and developmental prosopagnosia
Figure 2 A representation of the core face network – including the fusiform face area (blue), the occipital face area (green), and the posterior superior temporal sulcus (red).
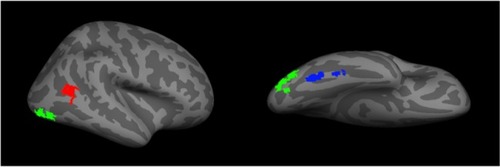
Figure 3 Examples of lesions that produce acquired prosopagnosia.
Notes: Approximate lesions, as can be seen on a single slice, are outlined in red. Patients with bilateral occipital temporal lesions (left) often experience apperceptive prosopagnosia and those with anterior temporal lesions (right) often experience associative prosopagnosia. These cases demonstrate that acquired prosopagnosia is a family of disorders with different mechanisms and different lesion locations that lead to the same end result of prosopagnosia.