Figures & data
Figure 1 The developmental increase in rhodopsin content of the retina and temporal retinal coverage by large vessels.
Notes: As rod photoreceptor development proceeds, the rod outer segments elongate and rhodopsin content increases. These measures of rhodopsin extracted from whole retinae are companions for the full-field electroretinography that is used to evaluate rod activity. The red arrow indicates the onset of prethreshold ROP as described by Palmer et al.Citation4 Copyright © 1999. Association for Research in Vision and Ophthalmology. Adapted from Fulton AB, Dodge J, Hansen RM, Williams TP. The rhodopsin content of human eyes. Invest Ophthalmol Vis Sci. 1999;40(8):1878–1883.Citation74 Data for vessel coverage values from Provis JM. Development of the primate retinal vasculature. Prog Retin Eye Res. 2001;20:799–821.Citation6
Abbreviation: ROP, retinopathy of prematurity.
Abbreviation: ROP, retinopathy of prematurity.
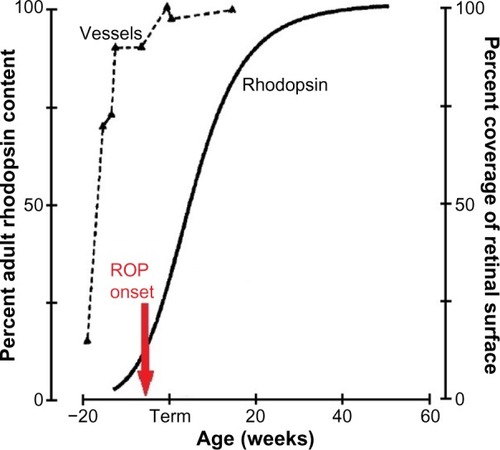
Table 1 Classification of subjects in our ROP studies
Figure 2 Sample rod-mediated ERG responses to full-field stimuli.
Notes: (A) Responses from an infant with a history of mild ROP and a healthy term-born 10-week-old infant, both tested at 10 weeks post-term, and from an adult. For all three sets of records, the vertical axis indicates the strength of the stimulus flash in log scotopic trolands and the horizontal axis indicates time in milliseconds. For both infant and adult, the amplitude of the response increases with increasing stimulus strength. At lower intensities, b-waves, but no a-waves, are seen. At higher strengths, the downward going a-wave appears. In these test conditions, the a-wave represents the molecular events involved in the activation of phototransduction in the rod outer segments. The b-wave represents post-receptor activity, including that in the rod-driven bipolar cells. (B) A-wave model fits. An expanded view of the a-waves of term-born infant and adult subject is shown. The solid lines are the ERG traces. The dashed lines show the fit of the mathematical Lamb and Pugh model of rod phototransduction, as modified by Hood and Birch, to the a-waves.Citation75–Citation77 The model parameters obtained by this calculation are shown on each panel. Rod sensitivity, SROD, is lower in the infant than in the adult. In the normally developing eye, SROD is scaled by the rhodopsin content of the retina. (C) Log–log plot of b-wave stimulus/response functions of term-born infant (circles) and adult (triangles). The b-wave amplitude is shown as a function of stimulus strength. The smooth curve fit to the data of each subject represents the function V/VMAX = I/(I+σ).Citation78 The saturated amplitude, VMAX, and the stimulus (I) that produces a half maximum amplitude response, log σ, are indicated for the adult subject. Log σ is an index of rod-mediated post-receptor retinal sensitivity.
Abbreviations: ERG, electroretinogram; ROP, retinopathy of prematurity.
Abbreviations: ERG, electroretinogram; ROP, retinopathy of prematurity.
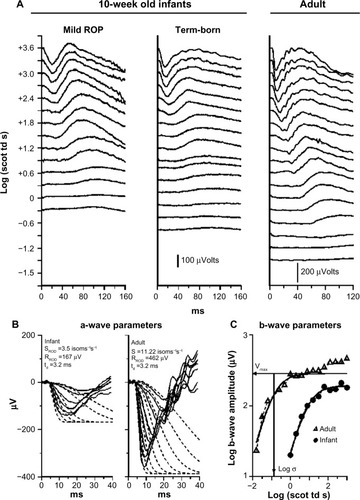
Figure 3 Rod-mediated spatial summation.
Notes: (A) DCRIT values in severe ROP, mild ROP, no ROP, and term-born control groups are plotted. Each point represents an individual subject; the number of subjects in each group is indicated. The horizontal bars indicate the mean DCRIT value for each group. (B) The log–log plot demonstrates that reciprocity held. In every subject group, for the smaller spots, threshold became lower (more sensitive) with increasing stimulus area. For larger diameter spots, the threshold did not change; summation was complete. (A) Copyright © 2014. Association for Research in Vision and Ophthalmology. Adapted from Hansen RM, Tavormina JL, Moskowitz A, Fulton AB. Effect of retinopathy of prematurity on scotopic spatial summation. Invest Ophthalmol Vis Sci. 2014;55(5):3311–3313.Citation27
Abbreviations: DCRIT, critical diameter; ROP, retinopathy of prematurity.
Abbreviations: DCRIT, critical diameter; ROP, retinopathy of prematurity.
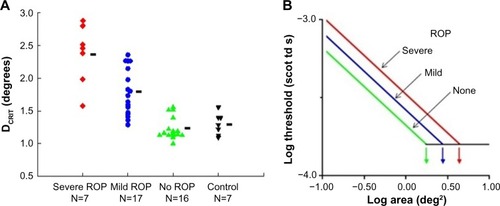
Figure 4 Rod-mediated temporal summation.
Notes: (A) tCRIT values in former preterm subjects with a history of severe ROP, mild ROP, and no ROP and in term-born controls are plotted. Each point represents individual subjects; the number of subjects in each group is indicated. The horizontal bars indicate the mean tCRIT value for each group. (B) As shown in the log–log plot, reciprocity held. In every subject group, for the brief duration stimuli, threshold became lower (more sensitive) with increasing stimulus duration. For longer duration stimuli, the threshold did not change; summation was complete. (A) Copyright © 2015. Association for Research in Vision and Ophthalmology. Adapted from Hansen RM, Moskowitz A, Tavormina JL, Bush JN, Soni G, Fulton AB. Temporal summation in children with a history of retinopathy of prematurity. Invest Ophthalmol Vis Sci. 2015;56(2):914–917.Citation26
Abbreviations: tCRIT, critical duration; ROP, retinopathy of prematurity.
Abbreviations: tCRIT, critical duration; ROP, retinopathy of prematurity.
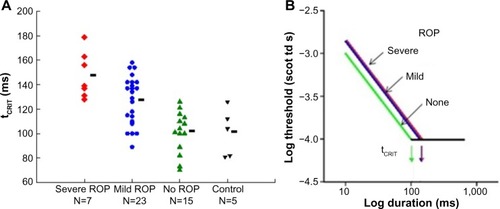
Figure 5 Diagram of the International Classification of Retinopathy of Prematurity zonesCitation24 with a superimposed fundus photograph on which the optic disc and fovea are indicated.
Notes: The green circle indicates the region of retina viewed through a 28 diopter lens used with the indirect ophthalmoscope. The band delineated by the yellow lines represents the location of the anatomical “rod ring”,Citation9 which is an annular region in which there is a high density of rods. The ring is concentric with the fovea and passes just nasal to the optic disc and approximately 18° temporal to the fovea.
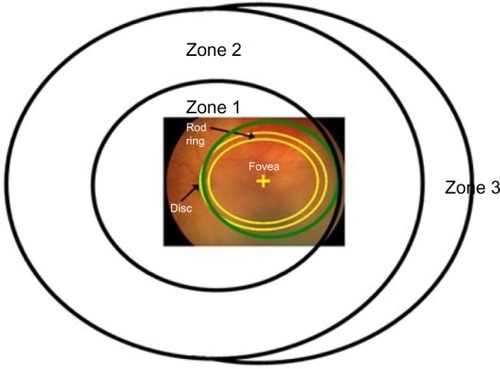
Figure 6 Adaptive optics OCT images of ROP and control subjects.
Notes: A subset of the ROP subjects (n=5) who had participated in our mfERG studyCitation50 also participated in the imaging study.Citation28 In the center panels, OCT images of controls (left) and ROP subjects (right) are shown. The slices were taken through the fovea. On each image, the subject number and eye are indicated. The main findings were significantly shallower pits and significantly thicker post-receptor laminae in the ROP subjects than in the control subjects. En face images of the outer plexiform layer show a clear foveal avascular zone in the controls, but the ROP subjects had abnormal vessels that traversed the foveal region. OCT images Copyright © 2008. Association for Research in Vision and Ophthalmology. Reproduced from Hammer DX, Iftimia NV, Ferguson RD, et al. Foveal fine structure in retinopathy of prematurity: an adaptive optics Fourier domain optical coherence tomography study. Invest Ophthalmol Vis Sci. 2008;49(5):2061–2070.Citation28 Color-coded 3-D topographical mfERG response density maps are shown for a control subject (upper left) and for a subject with a history of mild ROP (upper right).
Abbreviations: mfERG, multifocal ERG; OCT, optical coherence tomography; OD, right; OS, left; ROP, retinopathy of prematurity; ILM, inner limiting membrane; NFL, nerve fiber layer; GCL, ganglion cell layer; IPL, inner plexiform layer; INL, inner nuclear layer; OPL, outer plexiform layer; ONL, outer nuclear layer; ELM, external limiting membrane; CC, connecting cilium; RPE, retinal pigment epithelium; C, choroid.
Abbreviations: mfERG, multifocal ERG; OCT, optical coherence tomography; OD, right; OS, left; ROP, retinopathy of prematurity; ILM, inner limiting membrane; NFL, nerve fiber layer; GCL, ganglion cell layer; IPL, inner plexiform layer; INL, inner nuclear layer; OPL, outer plexiform layer; ONL, outer nuclear layer; ELM, external limiting membrane; CC, connecting cilium; RPE, retinal pigment epithelium; C, choroid.
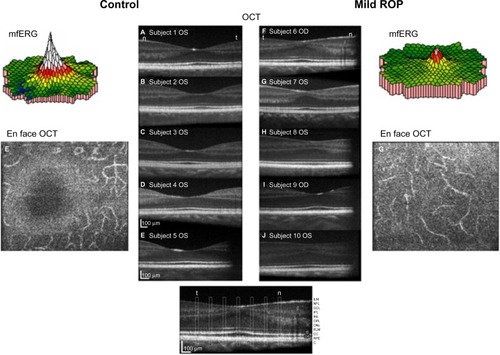
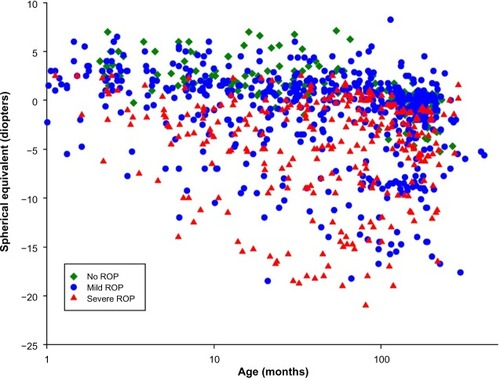
Figure 7 Spherical equivalent refraction (diopters) as a function of age (months).
Notes: Data are shown for 1,027 refractions of the right eye in 279 prematurely born subjects. One to 19 (median =2) refractions were performed on an individual; all refractions are shown. Green diamonds: 158 refractions from 78 subjects who never developed ROP; blue circles: 568 refractions from 154 subjects who had mild ROP; red triangles: 301 refractions from 47 subjects who had severe ROP.
Abbreviations: ROP, retinopathy of prematurity; PL, prediction limit.
Abbreviations: ROP, retinopathy of prematurity; PL, prediction limit.