Figures & data
Figure 1 Map of regional changes in human foveal development by age from 31 weeks PMA until adulthood.
Notes: Three-dimensional maps of human foveae from (A) 31–43 weeks PMA and (B) after term birth. Three-dimensional maps are constructed from vertical scans through the macula for 31 and 34 weeks PMA and from horizontal scans for the other time points. The central foveal SDOCT scan from each set is displayed in the top row. The SDOCT scans demonstrate a progressive deepening of the foveal pit before 40 weeks PMA and subsequent PRL thickening in (B). Total retina thickens gradually in all regions predominantly in the parafoveal area. The IRL demonstrates a centrifugal displacement of layers by a central pit size expansion and a parafoveal ring thickening. In contrast, the PRL grew centripetally from a thin layer at 31 weeks with the thinnest area around foveal center (magenta asterisk) to the fully developed PRL in adulthood with the thickest point at the center. Of note, PRL growth occurs largely after term birth (B). Growth of the left eye (OS) layer proceeds from complete absence at 31 weeks PMA (peripheral nonblue area represents flipping artifact at the edge of the scan) to adulthood in a centripetal pattern. Note that OS reaches the foveal center at 43 weeks PMA and continues with significant growth after term birth and well into childhood. The 31-week PMA subject was born at 27 weeks PMA (birth weight 1,205 g, ROP zone II, stage 2). The scans from 34 to 43 weeks correspond to an infant born at gestational age 27 weeks PMA with a birth weight of 1,205 g, ROP zone II, stage 2 for all time points. Ophthalmology. 2011. Maldonado RS, O’Connell RV, Sarin N, et al. Dynamics of human foveal development after premature birth, 118:2315–2325.Citation30 © 2011 with permission from Elsevier. http://www.journals.elsevier.com/ophthalmology/.
Abbreviations: IRL, inner retinal layer; OS, outer segment; PMA, postmenstrual age; PRL, photoreceptor layer; ROP, retinopathy of prematurity; SDOCT, spectral domain-optical coherence tomography; TRL, total retinal layer.
Abbreviations: IRL, inner retinal layer; OS, outer segment; PMA, postmenstrual age; PRL, photoreceptor layer; ROP, retinopathy of prematurity; SDOCT, spectral domain-optical coherence tomography; TRL, total retinal layer.
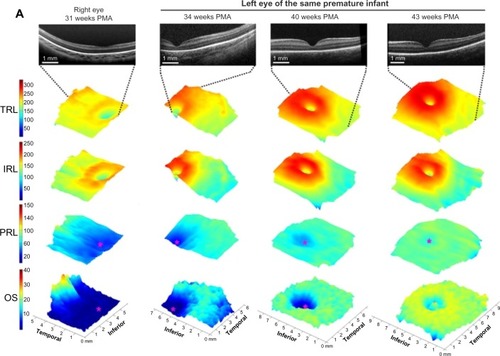
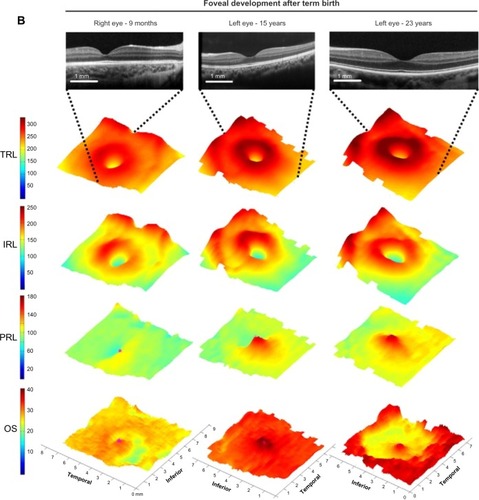
Figure 2 SDOCT histology comparison of normal premature infant retinas.
Notes: (A) Phase 1; (B) Phase 2. SDOCT numeric bands are indicated in (A) left and (B) left. Bands are matched as near as possible for a 31 weeks PMA SDOCT (top left) and 27 weeks PMA light micrograph (A right, projected ~2:1 scale to match SDOCT, seen in the “tall” single row of nuclei in the ONL) through the fovea. In phases 1–2, the GCL + IPL band at the fovea is primarily IPL. In Phase 1, the IS and OS are too short to form band 8. In Phase 2, peripheral IS (B left, box) is now long enough to be imaged as band 8 in SDOCT. In Phase 2 on histology (B, right), ELM is indicated by horizontal white arrowheads, but is not distinct on SDOCT (B, left). 1, NFL; 2, GCL; 3, IPL; 4, INL; 5, OPL on OCT and includes photoreceptor synapses (OPL/PSL); however, Henle fibers (Ax), which are part of histologic OPL, are hyporeflective and included in 6, ONL HFL on OCT; 8, photoreceptor ISE; 10, RPE, which is split into two hyperreflective bands. The images are shown at 2:1 axial/lateral ratio to aid in viewing layers and to mimic typical SDOCT viewing. Reprinted from Am J Ophthalmol. 2012, Vajzovic L, Hendrickson AE, O’Connell RV, et al. Maturation of the human fovea: correlation of spectral-domain optical coherence tomography findings with histology, 154:779–789.e2.Citation34 © 2012 with permission from Elsevier. http://www.ajo.com/.
Abbreviations: ELM, external limiting membrane; GCL, ganglion cell layer; INL, inner nuclear layer; IPL, inner plexiform layer; IS, inner segment; ISE, inner segments ellipsoid; NFL, nerve fiber layer; ONL, outer nuclear layer; OPL, outer plexiform layer; OS, outer segment; PMA, postmenstrual age; RPE, retinal pigment epithelium; SDOCT, spectral domain optical coherence tomography.
Abbreviations: ELM, external limiting membrane; GCL, ganglion cell layer; INL, inner nuclear layer; IPL, inner plexiform layer; IS, inner segment; ISE, inner segments ellipsoid; NFL, nerve fiber layer; ONL, outer nuclear layer; OPL, outer plexiform layer; OS, outer segment; PMA, postmenstrual age; RPE, retinal pigment epithelium; SDOCT, spectral domain optical coherence tomography.
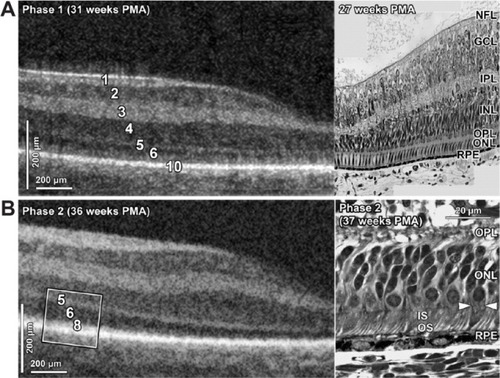
Figure 3 Morphologic characteristics and phenotypes of CME observed by use of SDOCT.
Notes: Three CME phenotypes were observed: single central (A), parafoveal (when cystoid structures were grouped around the foveal center, as shown within the white encircled areas) (B), and multiple elongated cystoid structures when the parafoveal and central fovea contained cystoid structures (C–E). For the multiple elongated CME phenotype, severity was scored as mild (C) if the foveal pit was present, moderate (D) if the fovea was bulging but the photoreceptor layer was not affected, and severe (E) if the fovea and photoreceptor layer had a bulging shape (white arrow). A magnified SDOCT scan shows the morphologic characteristics found in severe CME (F). The white asterisk is located within one cystoid space. Reprinted from Arch Ophthalmol. 2012. Maldonado RS, O’Connell R, Ascher SB, et al. Spectral-domain optical coherence tomographic assessment of severity of cystoid macular edema in retinopathy of prematurity,130:569–578.Citation39 Copyright © 2012 American Medical Association. All rights reserved.
Abbreviations: CME, cystoid macular edema; SDOCT, spectral domain optical coherence tomography.
Abbreviations: CME, cystoid macular edema; SDOCT, spectral domain optical coherence tomography.
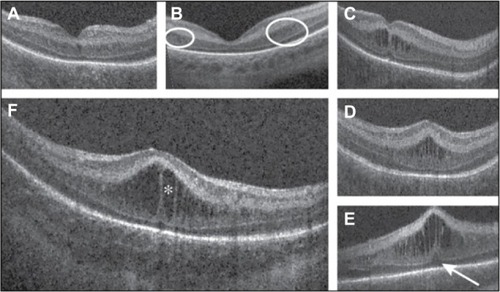
Figure 4 Evaluation of infant retinal vasculature with SDOCT.
Notes: The SDOCT scans from a 31-week PMA neonate (A) with retinopathy of prematurity (ROP) zone II, stage 2, and normal vasculature per clinical examination and a 48-week PMA neonate (B) with ROP zone II, stage 3, and plus disease. No vessel elevation is seen in (A) and severe vessel elevation is seen in (B). Retinal images (C, D) created from axial compression of SDOCT scans. (E) and (F) contain the same scans as (A) and (B), respectively, but highlight the smooth retinal layer contour in (E) and the scalloped pattern on (F). Red asterisks are placed over vessels, and the corresponding location on the retinal image is shown on (C) and (D). White arrows point to shadow produced by the corresponding vessels (E) and (F), The top light green line represents the inner plexiform layer, and the bottom dark green line represents the outer plexiform layer. Reprinted from Ophthalmology. 2014, Maldonado RS, Yuan E, Tran-Viet D, et al. Three-dimensional assessment of vascular and perivascular characteristics in subjects with retinopathy of prematurity. 121:1289–1296.Citation44 ©2014 with permission from Elsevier. http://www.journals.elsevier.com/ophthalmology/.
Abbreviations: PMA, postmenstrual age; SDOCT, spectral domain optical coherence tomography.
Abbreviations: PMA, postmenstrual age; SDOCT, spectral domain optical coherence tomography.
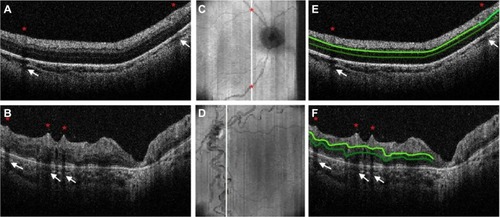
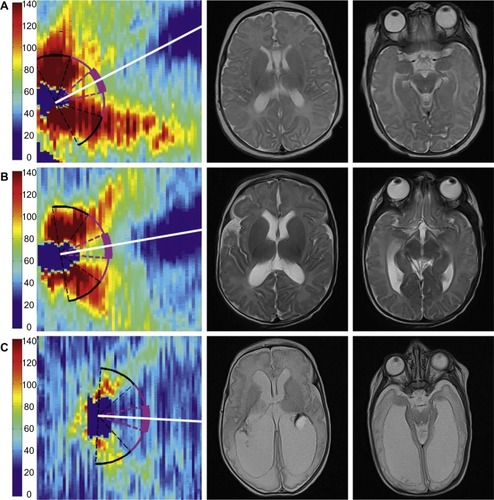
Figure 5 Very preterm infant RNFL thickness maps at term equivalent age (left column) and their corresponding near-term T2-weighted brain MRI (B, right columns).
Notes: (A), black female born at 24 weeks gestational age and 640 g who developed plus disease requiring laser treatment. RNFL thickness map at 37 weeks postmenstrual age measures mean RNFL thickness across the papillomacular bundle (thick pink arc) and temporal quadrant (thin pink arc) of 73 and 86 µm, respectively. Brain MRI at 44 weeks postmenstrual shows a near-normal global brain with global brain MRI lesion burden index of 2 (due to a white matter subscore of 2). (B), black female born at 23 weeks gestational age and 475 g who developed stage 3 retinopathy of prematurity requiring laser treatment. RNFL thickness map at 37 weeks postmenstrual age measures mean RNFL thickness across the papillomacular bundle and temporal quadrants of 51 and 74 µm, respectively. Brain MRI at 46 weeks postmenstrual age had a global brain MRI lesion burden index of 5 (white matter subscore of 4 and gray matter score of 1). The ventricles are mildly enlarged, especially in the occipital lobe area, consistent with mild white matter volume loss. (C), white male born at 25 weeks gestational age and 810 g who developed stage 3 retinopathy of prematurity requiring laser treatment. Cognitive, language, and motor Bayley subscores at 18–24 months corrected age were 75, 89, and 61, respectively. RNFL thickness map at 38 weeks postmenstrual age had mean RNFL thicknesses across the papillomacular bundle and temporal quadrants of 35 and 38 µm, respectively. Brain MRI at 36 weeks postmenstrual age had a global brain MRI lesion burden index of 15 (white matter subscore of 10 and gray matter subscore of 4). The ventricles are markedly enlarged, consistent with severe white matter volume loss. The scale on the thickness map represents thickness values in microns. Reprinted from Am J Ophthalmol. 2015. Rothman AL, Sevilla MB, Mangalesh S, et al. Thinner retinal nerve fiber layer in very preterm versus term infants and relationship to brain anatomy and neurodevelopment. 160:1296–1308.e2.Citation13 © 2015 with permission from Elsevier. http://www.ajo.com/.
Abbreviations: MRI, magnetic resonance imaging; RNFL, retinal nerve fiber layer.
Abbreviations: MRI, magnetic resonance imaging; RNFL, retinal nerve fiber layer.