
Figures & data
Table 1 Demographics of the study zone
Table 2 Birth weight and gestational age distribution of the study cohort
Table 3 ROP distribution in the study cohort
Table 4 ROP distribution compared during the two study periods
Figure 1 The graph depicts the trend of decline in the disease profile over the first 2 years and the latter 2-year period following the introduction of better neonatal care practices.
Abbreviations: ROP, retinopathy of prematurity; APROP, aggressive posterior ROP.
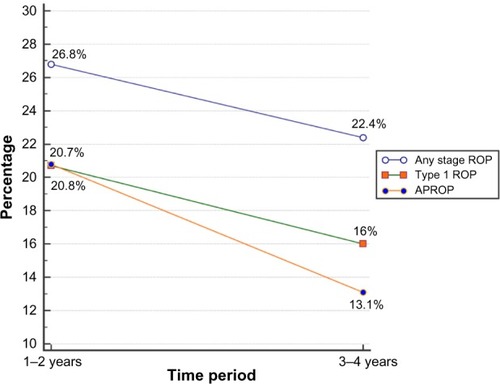
Figure 2 Left eye of a female infant born at 33 weeks weighing 1,750 g in a private rural neonatal center showing aggressive posterior retinopathy of prematurity with neovascularization in zone 1 (blue arrows), severe plus disease, and closed capillary loops.
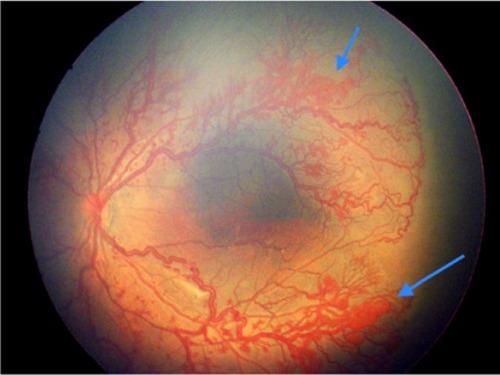
Figure 3 Left eye of a male infant born at 32 weeks weighing 1,300 g in a rural center showing occluded and closed loops of vessels abruptly stopping in posterior zone 1.
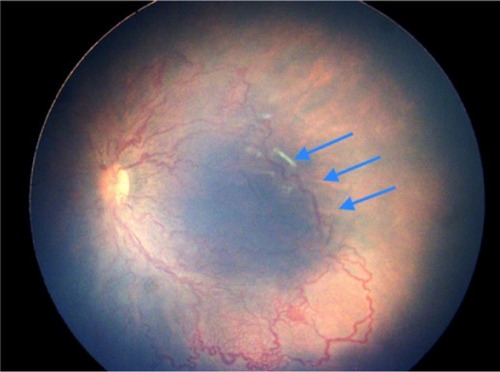
Figure 4 Left eye of a female infant born at 32 weeks weighing 1,400 g shows aggressive posterior ROP.
Abbreviation: ROP, retinopathy of prematurity.
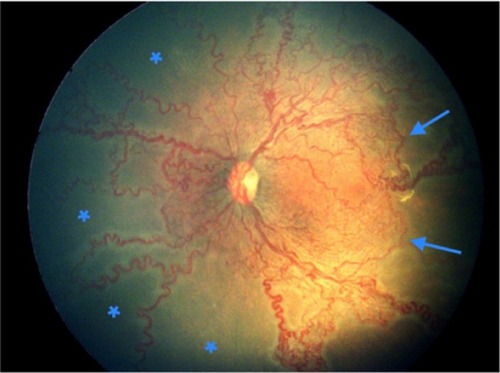
Figure 5 (A) Left eye nasal quadrant of a male baby born at 33 weeks weighing 1,500 g shows ischemic loops enclosing areas of capillary drop out extending until the anterior edge of zone 2. (B) The angiogram on the same eye confirms the capillary non-perfusion within these loops. Leaking neovascularization adjacent to the optic disc is also noted.
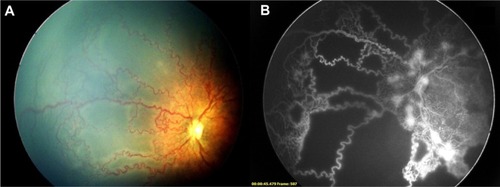
Table 5 Incidence of ROP in upper and lower middle-income countries