
Figures & data
Figure 1 Vapor pressure of elemental mercury as a function of temperature.
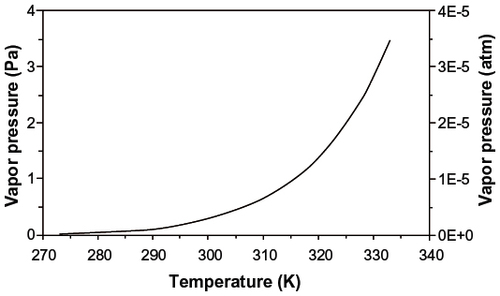
Figure 2 Solubility of elemental mercury in water as a function of temperature.
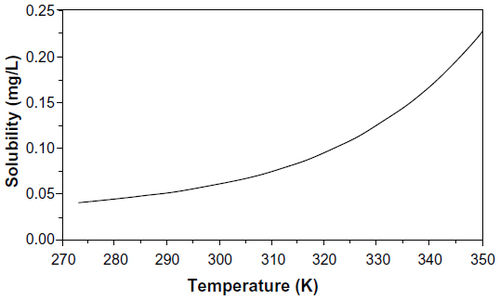
Figure 3 Henry’s law constant as a function of temperature for elemental mercury in water.
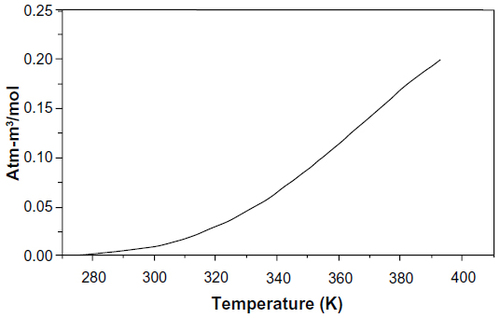
Table 1 Physical and chemical properties of mercury and some of its compounds at 20°C–25°C
Table 2 Stability constants for complexes formed by mercury(I) and mercury(II) in aqueous solution at 25°C
Figure 4 Methylation of mercury by methylcobalamine, a form of vitamin B12, to form the methylmercuric cation.
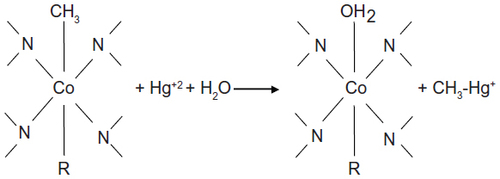
Figure 5 Mercury concentrations measured in ice cores obtained from the Upper Fremont Glacier in the Wind River Mountain Range of Wyoming.
Abbreviation: WWII, World War II.
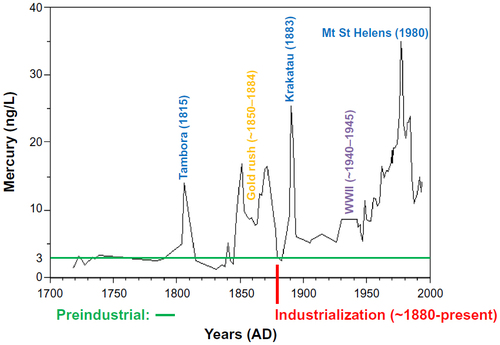
Figure 6 Relative contributions of estimated mercury emissions to the atmosphere from natural sources.
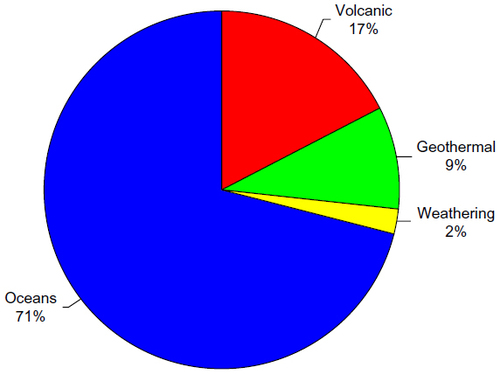
Figure 7 Relative contributions of estimated mercury emissions to the atmosphere from current anthropogenic sources.
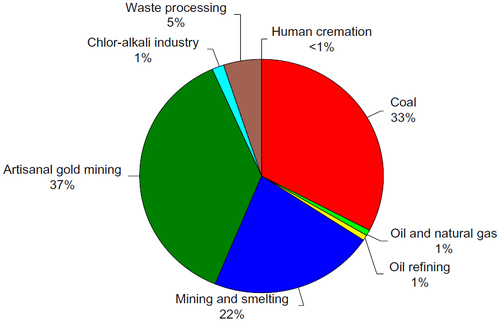
Table 3 Distribution of current anthropogenic mercury emissions to the atmosphere by region
Figure 8 Relative contributions of estimated mercury emissions to the atmosphere from historical anthropogenic sources.
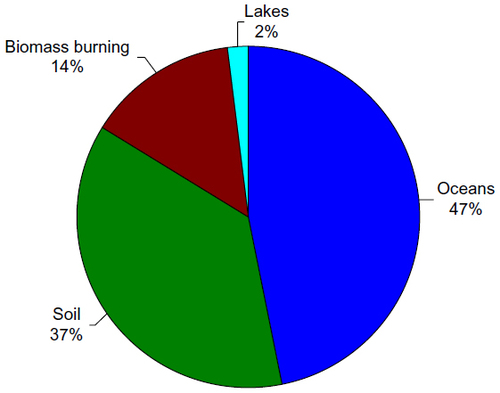
Table 4 Speciation of mercury emissions from different sources given as percent of total emissions
Table 5 Important reactions of mercury relevant to the atmosphere with overall rate constants and atmospheric mercury lifetimes estimated from reaction kinetics