
Figures & data
Table 1 Characteristics of the 21 patients with HER2-positive AGC receiving (11) versus not receiving (10) TBP
Figure 1 Median OS (A) and PFS (B) of the second-line TBP therapy.
Notes: (A) OS after starting the second-line therapy of patients receiving TBP as the second-line therapy. (B) PFS after starting the second-line therapy of patients receiving TBP as the second-line therapy.
Abbreviations: OS, overall survival; PFS, progression-free survival; TBP, trastuzumab beyond progression.
Abbreviations: OS, overall survival; PFS, progression-free survival; TBP, trastuzumab beyond progression.
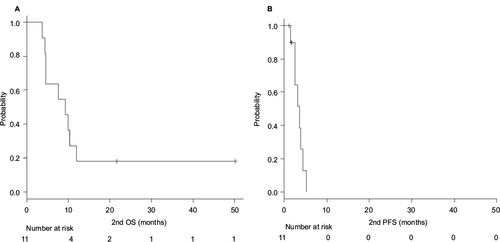
Figure 2 Median OS (A and B) and PFS (C) after starting the first-line therapy.
Notes: (A) OS after starting the first-line therapy for all 21 patients. (B) OS after starting the first-line therapy stratified by the presence or absence of TBP as the second-line therapy. (C) PFS after starting the first-line therapy stratified by the presence or absence of TBP as the second-line therapy.
Abbreviations: OS, overall survival; PFS, progression-free survival; TBP, trastuzumab beyond progression.
Abbreviations: OS, overall survival; PFS, progression-free survival; TBP, trastuzumab beyond progression.
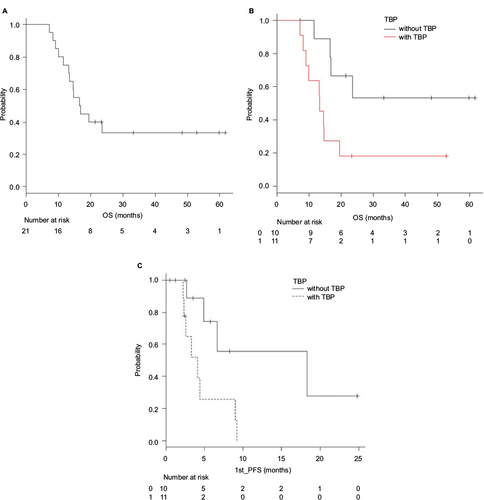
Figure 3 The PFS after the first-line chemotherapy, the duration of TBP and the OS are depicted as bar charts, in addition to the clinical outcomes of the first-line chemotherapy.
Abbreviations: PFS, progression-free survival; TBP, trastuzumab beyond progression; OS, overall survival; PR, partial response; CR, complete response; Pt, patient; AE, adverse events; SD, stable disease.
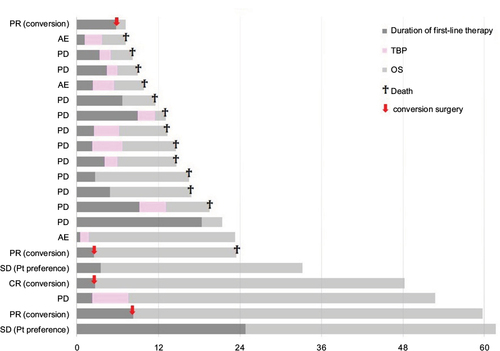
Table 2 Hematologic adverse events of patients receiving TBP
Table 3 Outcomes of clinical trials for patients with HER2-positive AGC