Figures & data
Figure 1 Liver and tumor tissue from mice with different genotypes show differing phenotypes on histological examination.
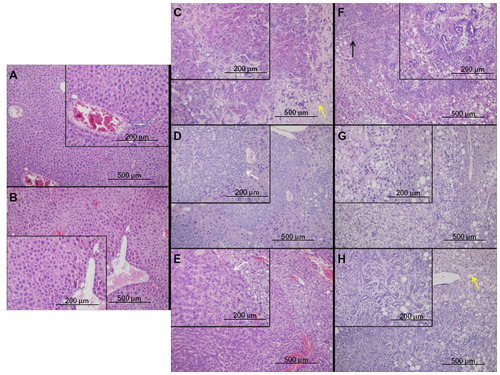
Figure 2 Genes related to hypoxia and fatty liver are differentially expressed between mouse genotypes.
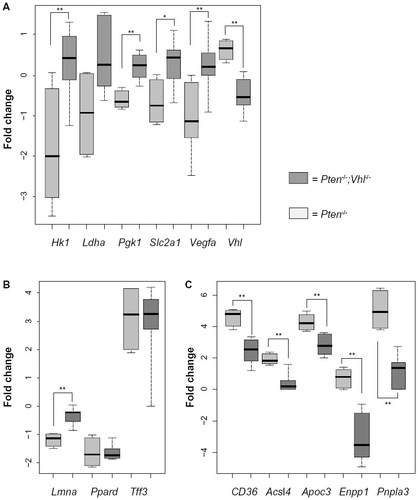
Figure 3 Human HCC and CC gene expression datasets show different regulation of genes related to fatty liver.
Abbreviations: HCC, hepatocellular carcinoma; CC, cholangiocarcinoma.
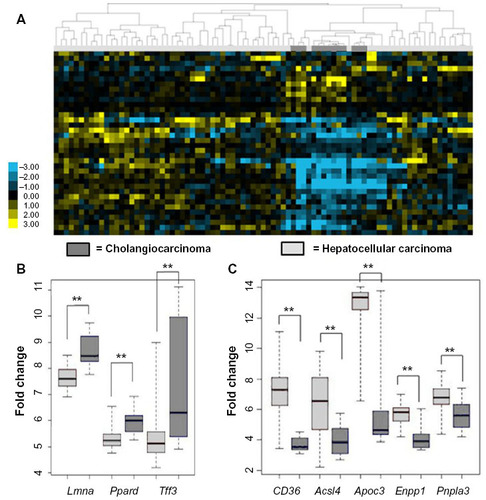
Figure 4 Genes specific to the hypoxia response show variable expression between human HCC and CC.
Abbreviations: HCC, hepatocellular carcinoma; CC, cholangiocarcinoma.
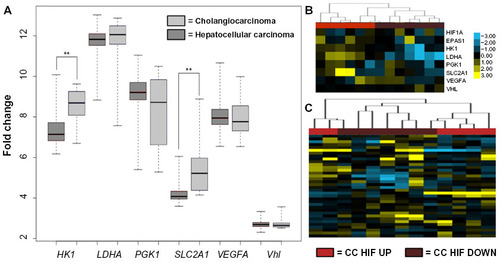
Table 1 Clinicopathologic characteristics of an independent cohort of human cholangiocarcinoma samples
Table 2 Clinicopathologic characteristics of human cholangio-carcinoma samples based on HIF-1α expression
Figure 5 HIF-1α is variably expressed in a UNC cohort of human CC and may influence disease severity.
Abbreviations: UNC, University of North Carolina; CC, cholangiocarcinoma.
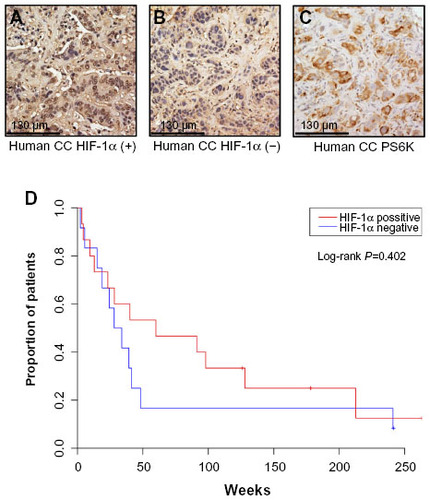
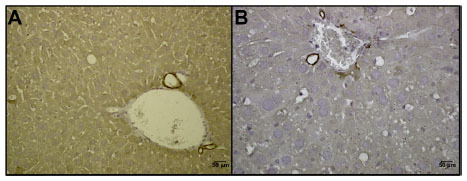
Figure S1 Keratin 18 staining in normal liver identifies sites of probable tumor origin.