
Figures & data
Table 1 Patient demographics
Figure 1 Immunohistochemistry staining of nuclear NF-κB (A and D), Gli-1 (B and E), and cytoplasmic staining of SHH (Cand F) in a representative non-exCTRT (A–C) and exCTRT (D–F) patient. Magnification: 40×.
Abbreviation: exCTRT, extreme resistance to chemoradiotherapy.
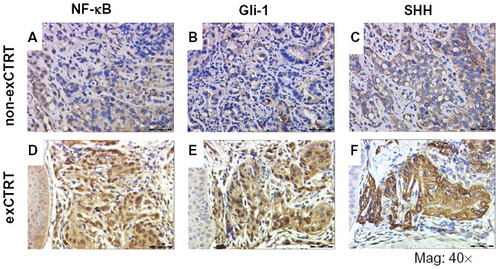
Table 2 Accuracy of the IHC predictive test
Table 3 Concordance between the two pathologic reviewers