
Figures & data
Figure 1 Schematic flow chart showing number of patients included in this analysis.
Abbreviations: ART, antiretroviral therapy; LTFU, lost to follow-up.
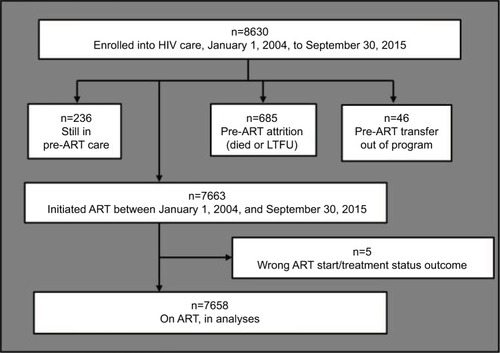
Table 1 Baseline characteristics
Figure 2 Trends in median CD4 cell count at ART initiation.
Abbreviation: ART, antiretroviral therapy.
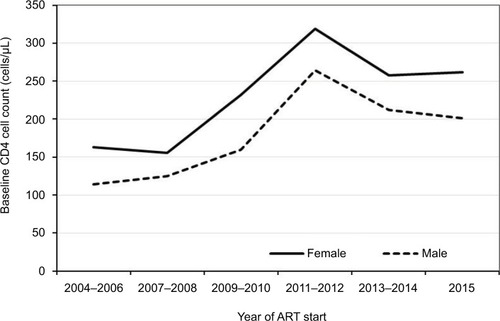
Table 2 (A) Trends in baseline demographic characteristics by year of ART start
Table 3 Treatment status outcomes at the end of the observation period
Table 4 Attrition by baseline characteristics
Table 5 Baseline characteristics associated with attrition (death or lost to follow-up) after ART initiation