
Figures & data
Table 1 Baseline and follow-up characteristics of the PLHIV initiating ART by age (N=73,525)
Figure 1 Probability of death (Kaplan–Meier estimate) after ART initiation by age groups.
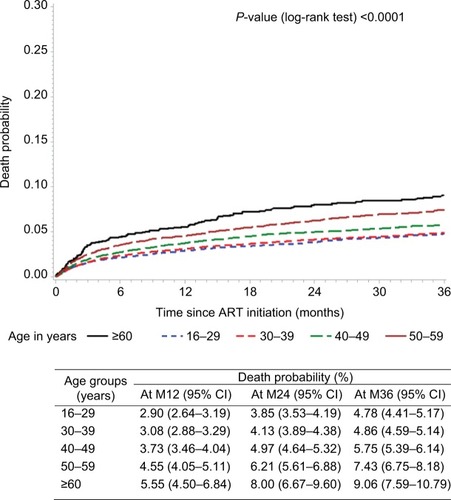
Figure 2 LTFU probability (Kaplan–Meier estimate) after ART initiation by age groups.
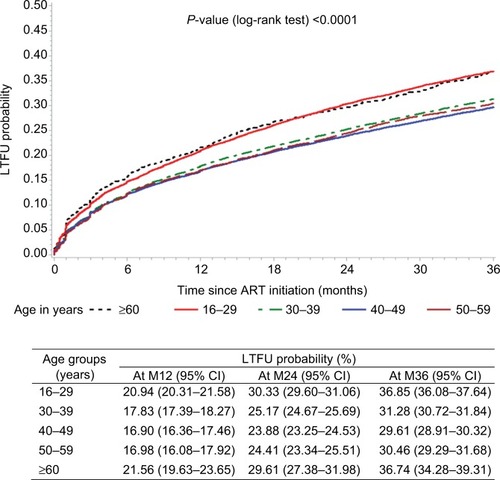
Table 2 Predictors of death in the first 36 months after ART initiation (Cox models)
Table 3 Predictors of lost to follow-up in the first 36 months after ART initiation (Cox models)
Figure S1 Flowchart.
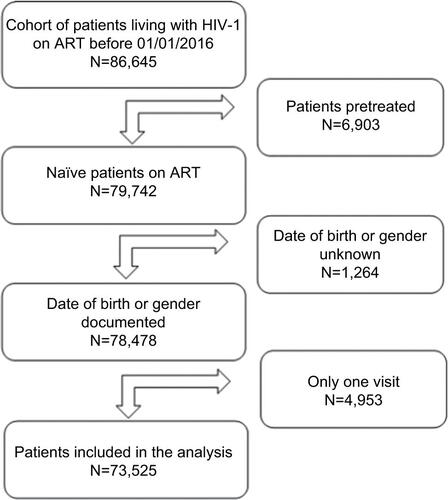
Table S1 Effect of other factors (than age), on lost to follow-up in the first 36 months after ART initiation (Cox models), for patients <30 years while starting ART
Table S2 Effect of other factors (than age), on lost to follow-up in the first 36 months after ART initiation (Cox models), for patients 50–59 years while starting ART
Table S3 Effect of others factor (than age), on lost to follow-up in the first 36 months after ART initiation (Cox models), for patients >60 years while starting ART