
Figures & data
Table 1 Demographics and risk factors among MSM in Chongqing and Sichuan Province, China
Table 2 Risk factors associated with HIV infection among MSM in Chongqing and Sichuan Province
Figure 1 Receiver operating characteristic curve about the prediction effect of the logistic regression model.
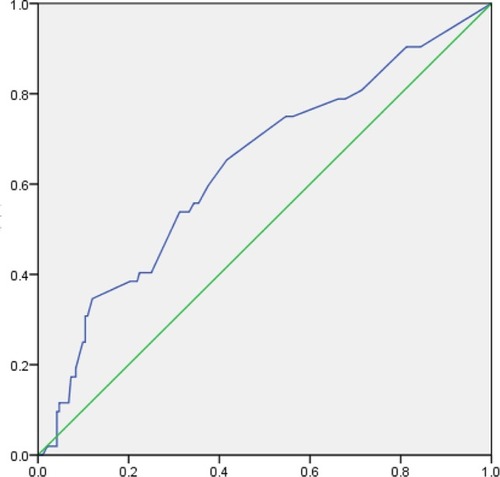
Figure 2 Distribution of HIV estimated probability among 962 MSM.
Abbreviation: MSM, men who have sex with men.
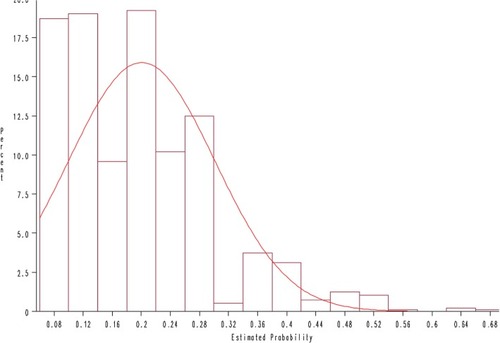
Table 3 Distribution of estimated HIV infection probability in 962 MSM