Figures & data
Figure 1 Prisma flow diagram illustrating selection of articles.
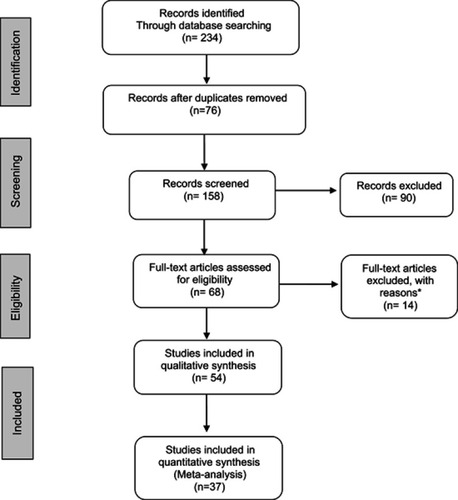
Table 1 Demographic characteristics of studies involved in meta-analysis
Table 2 The initial data on the prevalence of AIDS based on risk factors in the articles entered in the meta-analysis
Figure 2 The prevalence of HIV among sex workers based on the random effects model. The midpoint of each section estimates the prevalence and length of the line, the 95% confidence interval in each study, and the diamond shows the prevalence of HIV among sex workers in this study.
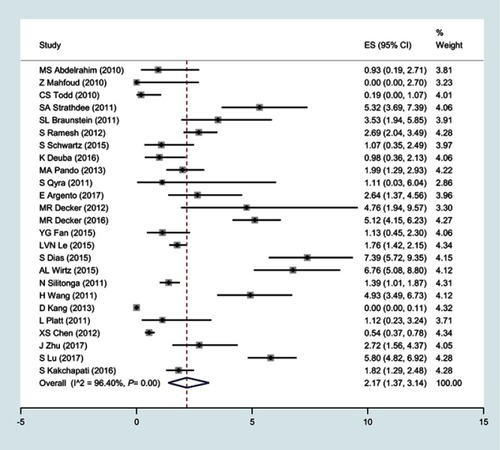
Figure 3 The prevalence of condom use in sex with clients by sex workers based on the random effects model. The midpoint of every line estimates the prevalence in each study, and the diamond shows the overall prevalence for all study.
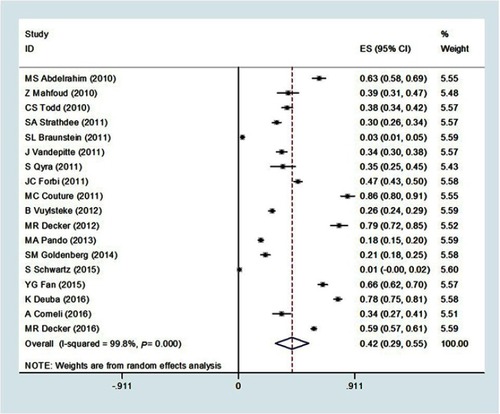
Figure 4 The prevalence of injecting drug use in sex workers based on the random effects model. The midpoint of each section of the line estimated prevalence in each study, and the diamond indicates the prevalence of injecting drug use for all studies.
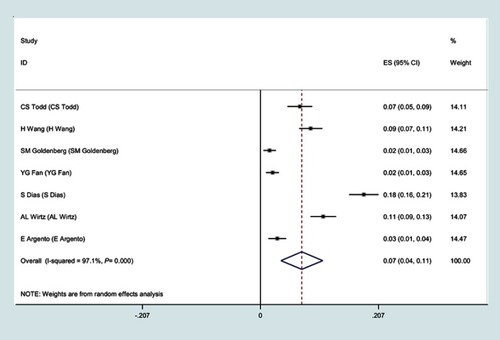
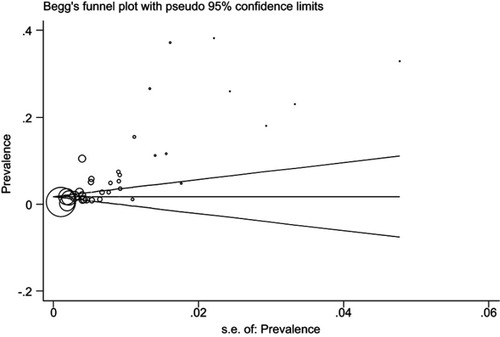
Figure 5 Begg’s funnel plot for publication bias.