
Figures & data
Figure 1 DTG molecular structure (adapted from PubChem).Citation22

Figure 2 3TC molecular structure (adapted from PubChem).Citation27
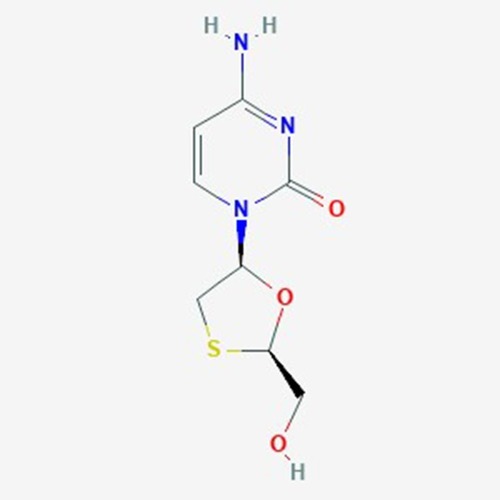
Table 1 Summary Of Clinical Trials – DTG/3TC For Treatment-Naive Individuals
Table 2 Select Adverse Effects Reported From Phase III Trials At Week 48
Table 3 Changes In Renal Biomarkers In GEMINI Trials
Table 4 Changes In Lipid Profiles In GEMINI Studies