
Figures & data
Figure 1 The age of HIV exposed infants during final diagnosis of HIV, at public health facilities in Dessie town, Ethiopia, 2017 (n =313).
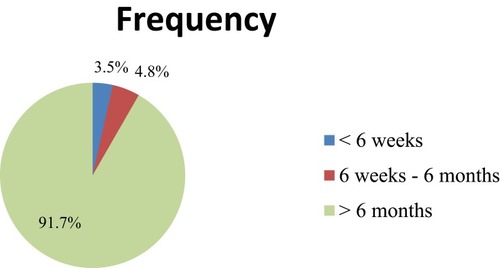
Figure 2 Method of HIV diagnosis for HIV exposed infants, at public health facilities in Dessie town, Ethiopia, 2017 (n = 313).
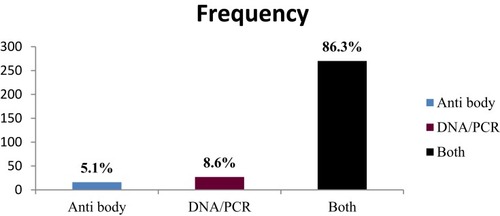
Table 1 Socio-Demographic Characteristics of HEIs and Their Mothers at Public Health Facilities in Dessie Town, Ethiopia, 2017 (n = 313)
Table 2 Frequency and Percentage of Prenatal, Intranatal, and Postnatal Findings of MTCT of HIV at Public Health Facilities in Dessie Town, Ethiopia, 2017 (n = 313)
Table 3 Frequency of Anti-Retroviral Intervention and Clinical Finding of HEIs and Their Mothers at Public Health Facilities in Dessie Town, Ethiopia, 2017 (N= 313)
Table 4 Bivariate and Multivariate Logistic Regression Analysis of Factors Associated with MTCT of HIV Among HEIs at Public Health Facilities in Dessie Town, Ethiopia, 2017 (n = 313)