Figures & data
Figure 1 Proportion of responders to rilpivirine (A) and efavirenz (B) in the THRIVE and ECHO studies. Response rate in subjects in the rilpivirine group was reduced when baseline viral load was >100,000 copies/mL.Citation26,Citation27
Abbreviations: THRIVE, TMC278 against HIV, in a once daily RegImen Versus Efavirenz; ECHO, Early Capture HIV Cohort Study.
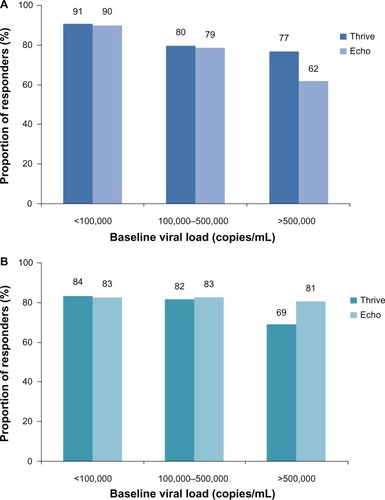
Figure 2 Lipid changes (mg/dL) in TDF/FTC/RPV versus continued ritonavir-boosted plus two NRTIs at week 24 after switching.
Abbreviations: HDL, high-density lipoprotein; LDL, low-density lipoprotein; NRTIs, nucleoside analog reverse transcriptase inhibitors; TC, total cholesterol; TDF/FTC/RPV, tenofovir/emtricitabine/rilpivirine; TG, triglyceride; RTV, ritronavir.
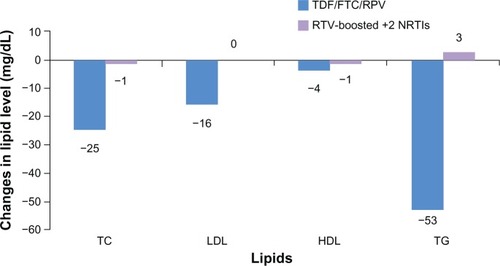
Table 1 Comparison of characteristics of non-nucleoside analog reverse transcriptase inhibitors that are recommended for treatment-naïve patients
Table 2 Summary characteristics of rilpivirine (Edurant®)