
Figures & data
Figure 1 Flowchart depicting selection process of study participants.
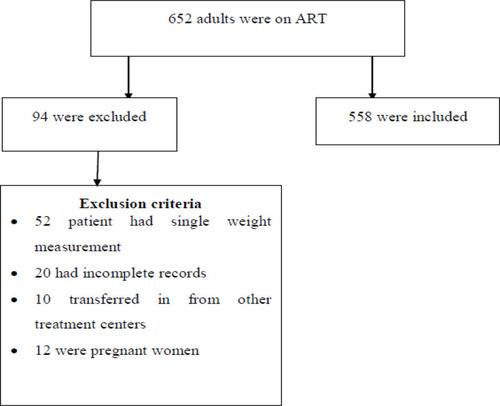
Table 1 Baseline Characteristics of PLWH in West Hararghe Zone, Eastern Ethiopia, 2013 to 2019
Figure 2 Individual profile plot for longitudinal weight trajectory among PLWH at public hospitals in west Hararghe zone, Eastern Ethiopia, 2013 to 2019.
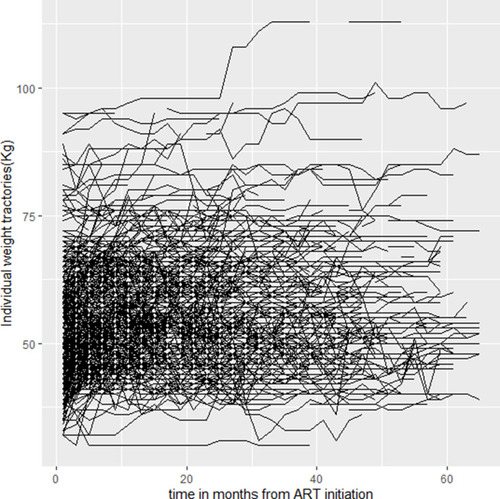
Figure 3 Overall mean weights for PLWH in West Hararghe Zone, Eastern Ethiopia 2013 to 2019.
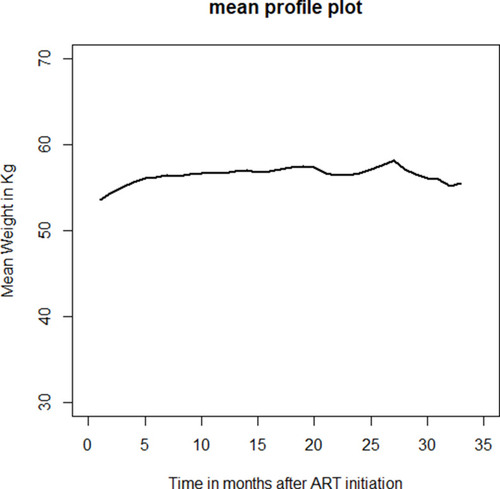
Table 2 Average Baseline and Follow-Up Values of Weight for PLWH in West Hararghe Zone, Eastern Ethiopia 2013 to 2019
Table 3 Model Comparison for Longitudinal Models Using Likelihood Ratio Test
Table 4 Linear Mixed Effect Model for Predictors of Longitudinal Changes in Weight Over Time for PLWH, 2013 to 2019