
Figures & data
Table 1 Socio-Demographic Characteristics of ART Attending Patients at Public Health Facilities of Southern Ethiopia, 2018
Table 2 Clinical Characteristics of ART Attending Patients at Public Hospitals in Southern Ethiopia, 2018
Figure 1 The Kaplan–Meier estimate of loss to follow-up among patients attending ART at public hospitals in Southern Ethiopia, 2018.
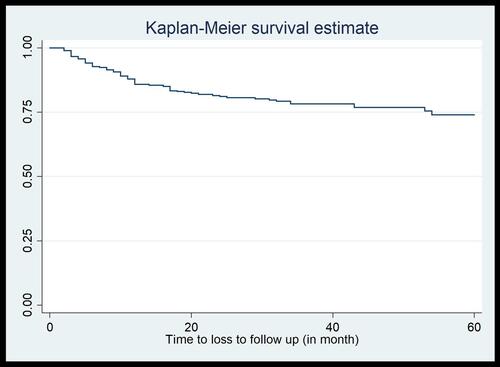
Table 3 The Log Rank Estimate of Variables Among ART Attending Patients in Public Hospitals in Southern Ethiopia, 2018
Table 4 The Estimated Survival Time of ART Attending Patients Over Specific Covariate of Variables at Public Hospitals in Southern Ethiopia, 2018
Figure 2 The Kaplan–Meier survival estimate of INH initiation among patients attending ART at public hospitals in Southern Ethiopia, 2018.
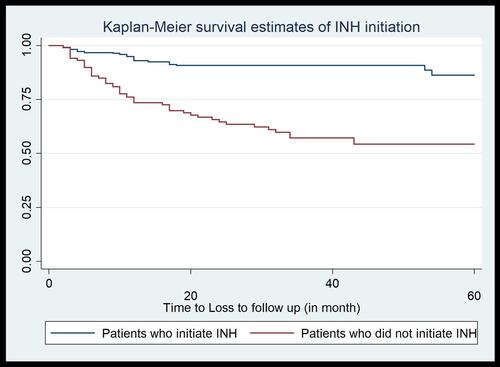
Figure 3 The Kaplan–Meier survival estimate of availability of care giver among patients attending ART at public hospitals in Southern Ethiopia, 2018.
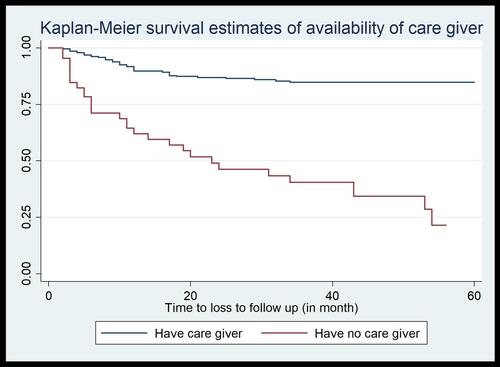
Table 5 Predictors of Loss to Follow-Up Among Patients Attending ART at Public Hospitals in Southern Ethiopia, 2018