
Figures & data
Table 1 Baseline Socio-Demographic and Clinical Characteristics of Patients Receiving ART in East Gojjam Zone Health Facilities, Northwest Ethiopia (N = 302)
Figure 1 Flowchart diagram of the study profile.
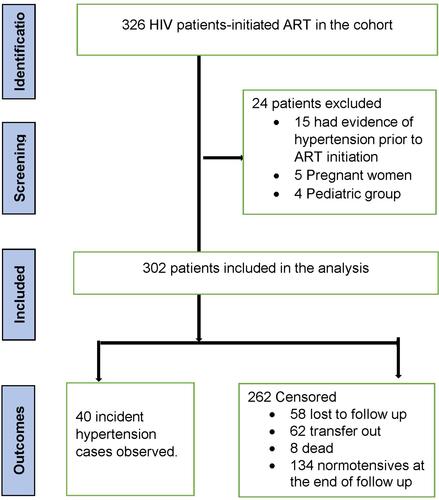
Figure 2 The Kaplan–Meier curve showing the survival probability of developing hypertension.
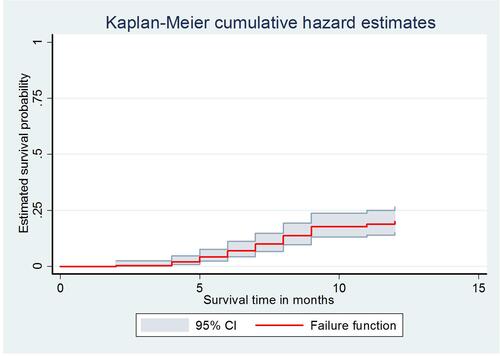
Figure 3 The Kaplan–Meier curve showing the survival probability of developing hypertension among HIV patients receiving ART based on sex.
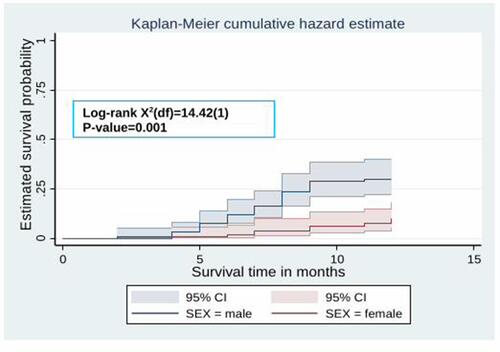
Figure 4 The Kaplan–Meier curve showing the survival probability of developing hypertension among HIV patients receiving ART based on age groups.
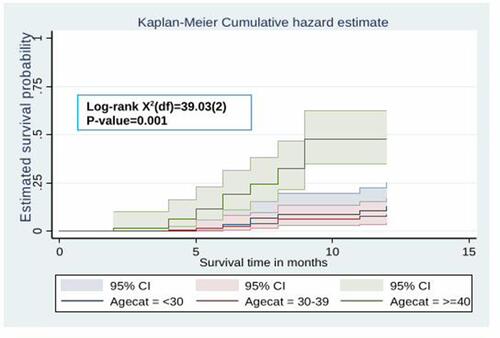
Figure 5 The Kaplan–Meier curve showing the survival probability of developing hypertension among HIV patients receiving ART based on body mass index.
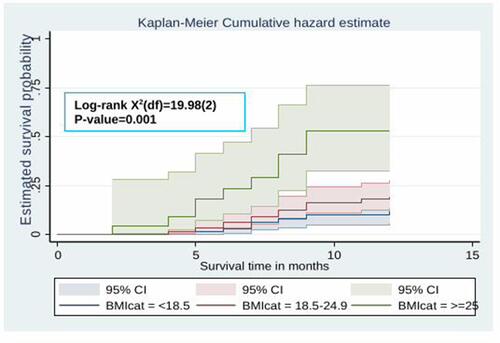
Figure 6 The Kaplan–Meier curve showing the survival probability of developing hypertension among HIV patients receiving ART based on DM comorbidity.
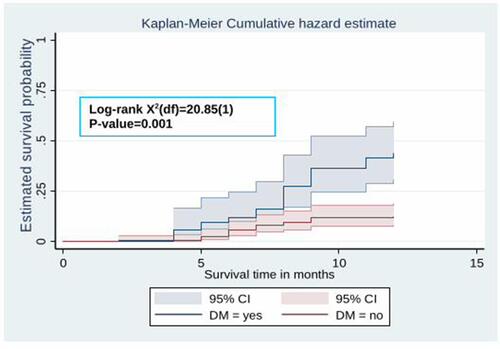
Figure 7 The Kaplan–Meier curve showing the survival probability of developing hypertension among HIV patients receiving ART based on ART regimen.
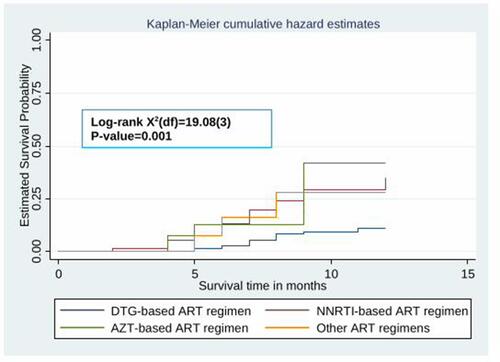
Table 2 The Bivariable and Multivariable Cox-Regression Analysis for Predictors of Hypertension Among HIV Patients Receiving ART, Northwest Ethiopia (N = 302)