
Figures & data
Table 1 Characteristic of Patients with Virologic Failure at 1st, 2nd, and 3rd Time Points after Commencement of cART
Figure 1 The area under the ROC for CD4 cell count and adherence at the 1st time point.
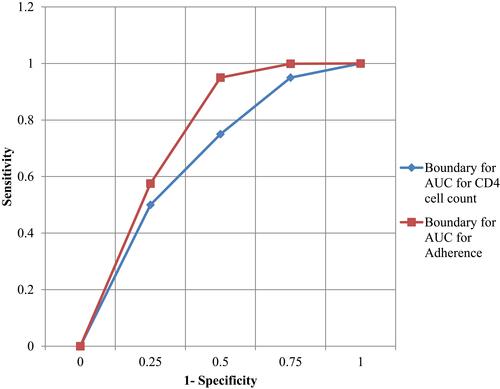
Figure 2 The area under the ROC for CD4 cell count and adherence at the 2nd time point.
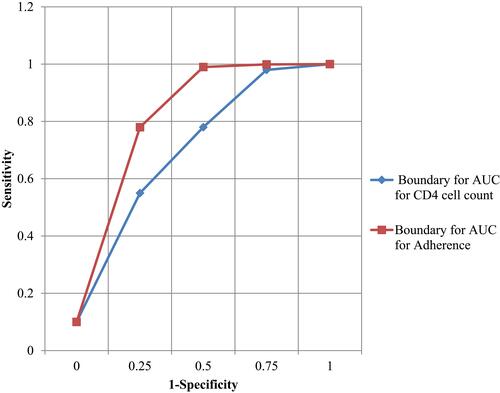
Figure 3 The area under the ROC for CD4 cell count and adherence at the 3rd time point.
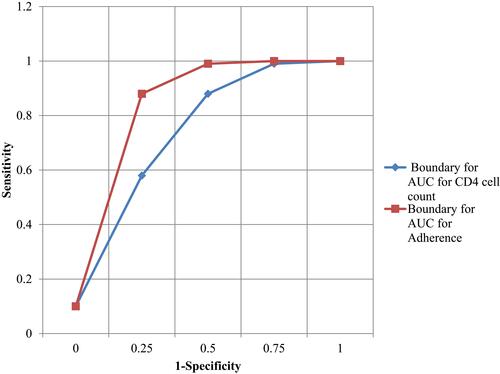
Table 2 Test Characteristics for CD4 Cell Count Change in Identifying Patients with Virologic Failure after Commencement of cART Assessed at 1st, 2nd, and 3rd Time Points
Table 3 Test Characteristics of Adherence to cART Level in Identifying Patients with Virologic Failure after Commencement of cART Assessed at 1st, 2nd, and 3rd Time-Points
Table 4 Test Characteristics for CD4 Cell Count Change and Adherence Levels for Identifying Patients with Breakthrough Virologic Failure after First Visiting Time
Table 5 PPVs of CD4 Cell Count and Adherence Level for Assessment of Virologic Failure at the 1st, 2nd, and 3rd Time Points
Table 6 NPVs for Combined CD4 Cell Count and Adherence Level for Virologic Failure at the 1st, 2nd, and 3rd Time-Points