
Figures & data
Table 1 Baseline Characteristics of HIV Positives Individuals Enrolled for ART Care Between 2011 and 2018 in Addis Ababa, Stratified by Tuberculosis Coinfection Status, n=7038
Figure 1 Selection procedure for the study population of adult HIV positives with and without TB coinfection enrolled on antiretroviral therapy at Addis Ababa from September 2011 to December 2018, n=7038.
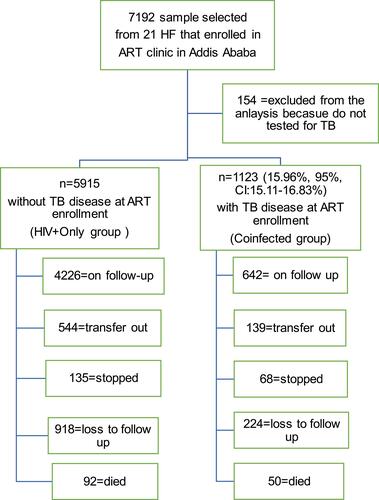
Table 2 Baseline Clinical and Health Factors of HIV Positives Initiating ART by Coinfection Status in Addis Ababa, Ethiopia (September 2011 to December 2018), n=7038
Figure 2 TB incidence in HIV positives enrolled in ART care between 2011–2018, Addis Ababa, Ethiopia, total person-time-month at risk population= 373,564. At risk, the population includes only those HIV positives without tuberculosis at antiretroviral therapy enrolment.
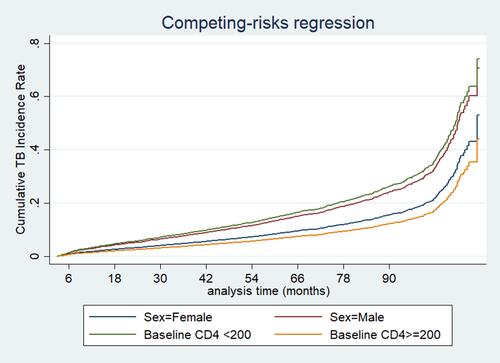
Table 3 Mortality per 100,000 Person-Time-Months in Adult’s HIV Positives Enrolled in ART Care by Coinfection Status in Addis Ababa, Between September 2011 to December 2018, n=7038
Table 4 Adjusted and Unadjusted Hazard Ratio of Outcomes in Coinfection with Use of Parametric Gompertz Regression Model, in Addis Ababa, Ethiopia, (September 2011 to December 2018)