
Figures & data
Figure 1 Proportional allocation of sample size among selected public hospitals in Addis Ababa, Ethiopia.
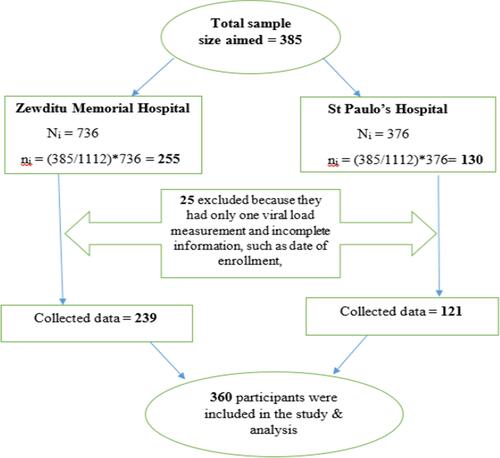
Figure 2 Kaplan–Meier survival function of the virological failure of HIV/AIDS patients on second-line ART at public hospitals of Addis Ababa Ethiopia, September 2018 to January 2021.
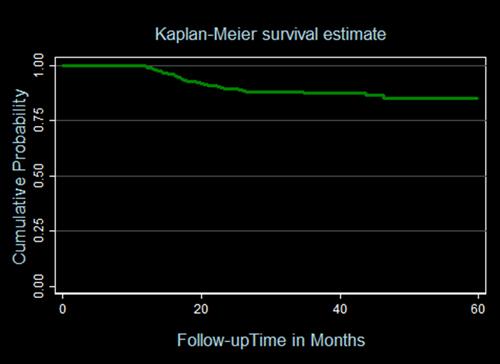
Figure 3 Plot of Nelson-Aalen cumulative hazard function against Cox–Snell residual for the virological failure of HIV/AIDS patients on second-line ART at public hospitals of Addis Ababa Ethiopia, September 2018 to January 2021.
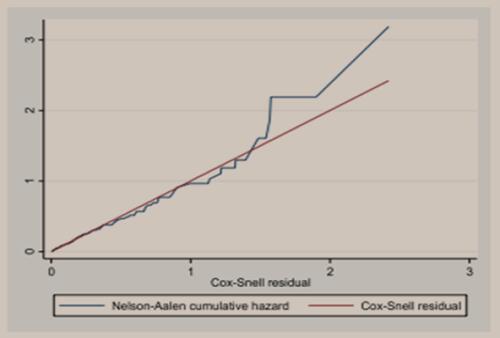
Table 1 Sociodemographic Characteristics of Patients on Second-Line ART at Public Hospitals of Addis Ababa Ethiopia, September 2018 to January 2021
Table 2 Characteristics of Patients During Switching and After Switched to Second-Line ART at Public Hospitals of Addis Ababa Ethiopia, September 2018 to January 2021
Table 3 Uni-Variable and Multivariable Cox Proportional Hazard Model for Predictors of Virological Failure Among HIV Patients on Second-Line ART at Public Hospitals of Addis Ababa Ethiopia, September 2018 to January 2021