
Figures & data
Figure 1 Schematic presentation of sampling procedure and technique in the evaluation of survival rate and safety outcome of DTG and EFV-based cART regimens among HIV-treated patients at DSH, DRH, and FHCSH, North-West–East Ethiopia, September 1, 2019 to August 30, 2020 (n=990).
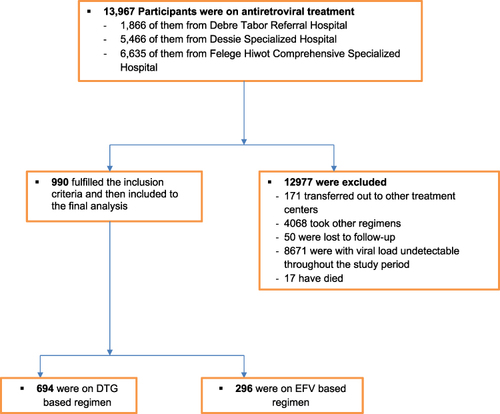
Table 1 Baseline Socio-Demographic and Clinical Characteristics of HIV Patients Treated with DTG and EFV-Based cART Regimens at DSH, DRH, and FHCSH, North-West–East Ethiopia, September 1, 2019 to August 30, 2020 (n=990)
Table 2 Kaplan–Meier Analysis of Good Survival Outcome* and Associated Factors for DTG Compared to EFV-Based Regimen Among HIV Patients in DSH, DRH, and FHCSH, North-West–East Ethiopia, from September 1, 2019 to August 30, 2020 (n=990)
Figure 2 Proportion of patients with viral load <50 copies/mL and <200 copies/mL at final measurement. Kaplan–Meier plots of time from baseline to the final HIV viral load measurement value of (A) <50 copies/mL and (B) <200 copies/mL at FHCSH, DRH, and DSH, North-West–East Ethiopia, September 1, 2019 to August 30, 2020 (n=990).
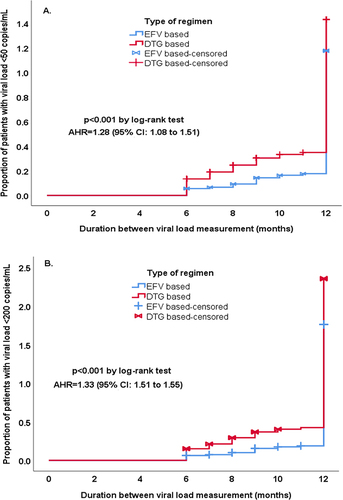
Table 3 Frequencies of Adverse Drug Events Experienced by HIV Patients Treated with DTG or EFV-Based Regimens at DSH, DRH, and FHCSH, North-West–East Ethiopia, from September 1, 2019 to August 30, 2020 (n=990)
Table 4 Bivariate and Multivariate Cox Regression Analysis of Predictors Associated with Viral Load Reduction to ≥50 Copies/mL Among HIV Patients Treated with DTG and EFV-Based Regimens at DSH, DRH, and FHCSH, North-West–East Ethiopia, from September 1, 2019 to August 30, 2020 (n=990)
Table 5 Bivariate and Multivariate Cox Regression Analysis of Predictors Associated with the Occurrence of Adverse Drug Events Among HIV Patients Treated with EFV and DTG-Based Regimens at DSH, DRH, and FHCSH, North-West–East Ethiopia, September 1, 2019 to August 30, 2020 (n=990)