
Figures & data
Table 1 Socio-Demographic Characteristics of the Study Participants Attending HUCSH from July to September 2020, Hawassa, Ethiopia (n = 273)
Table 2 Clinical Characteristics of HAART Experienced HIV Positive Children Attending HUCSH (N = 273)
Figure 1 Distribution of cytopenia among HIV positive children on HAART at HUCSH (N = 273).
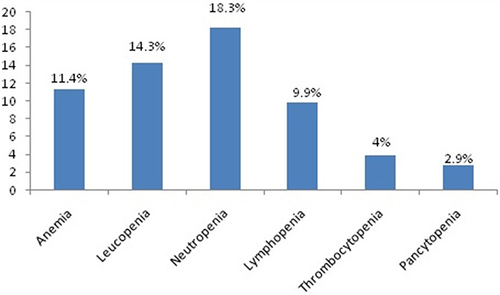
Figure 2 Gender wise distribution of cytopenia among HIV positive children on HAART at HUCSH (N = 273).
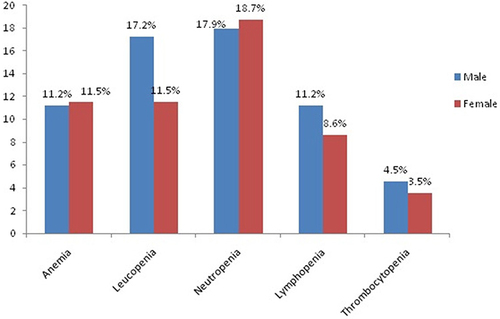
Figure 3 Distribution of cytopenia among HIV positive children on HAART at HUCSH stratified by age (N = 273).
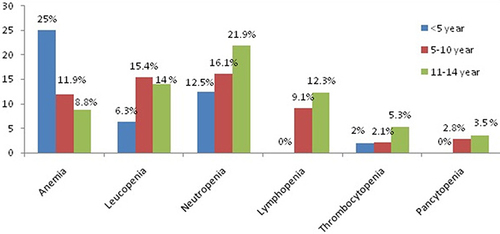
Table 3 Cytopenia Distribution of Study Participants by CD4 Percentage and Viral Load of HAART Experienced HIV Positive Children at HUCSH (N = 273)
Table 4 Correlation of Hematological Parameters with a Viral Load of HAART-Experienced HIV-Positive Children at HUCSH (N = 273)
Table 5 Factors Associated with Cytopenia Among HAART Experienced HIV Positive Children at HUCSH (N = 273)