
Figures & data
Table 1 Definitions of Disability Domains
Table 2 Socio-Demographic Characteristics of Study Participants (106)
Table 3 The Accessibility of Respondents to Health Facilities (n=106)
Table 4 The Frequency of Various Manifestations of Disability Among Study Respondents. (N=106)
Figure 1 The health system performance among people with disabilities attending HIV/AIDS treatment and care services in Bushenyi.
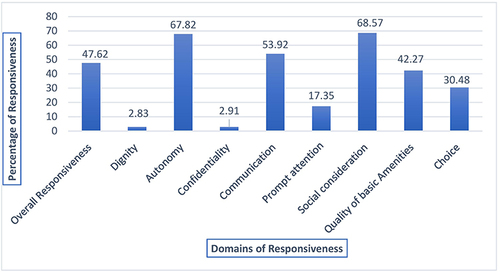
Table 5 Bivariate and Multi-Variate Logistic Regression Analysis for Factors Associated with Responsiveness to HATCS in Bushenyi