
Figures & data

Figure 1 A flow chart of recruitment among children receiving ART in Gamo and South Omo Zones public health facilities, Southern Ethiopia, 2022.
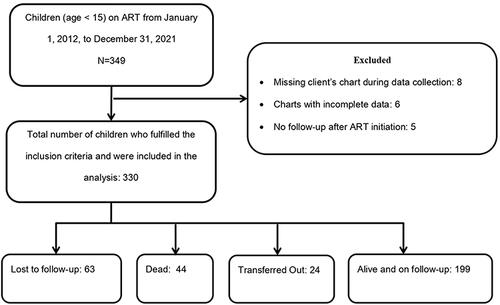
Table 1 Socio-Demographic Characteristics of Children Receiving ART at Public Health Facilities of Gamo and South Omo Zones, Southern Ethiopia, 2022 (N=330)
Table 2 Clinical and Treatment-Related Characteristics of Children Receiving ART at Public Health Facilities of Gamo and South Omo Zones, Southern Ethiopia, 2022 (N=330)
Table 3 Bivariable and Multivariable Analysis for Factors Associated with Attrition Among Children Receiving ART in Public Health Facilities of Gamo and South Omo Zones, Southern Ethiopia, 2022 (N=330)