Figures & data
Figure 1 Illustration of causal pathways.
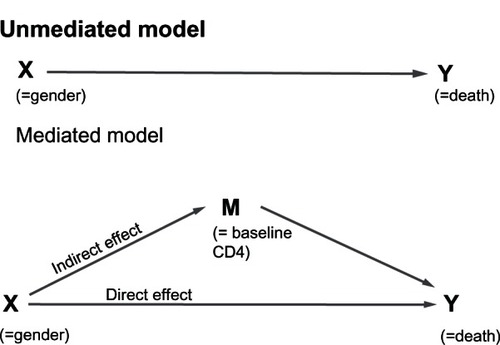
Table A1 A comparison of demographic, behavioral, and clinical characteristics across survival groups
Table 1 A comparison of demographic, behavioral, and clinical characteristics in men and women
Figure 2 Kaplan–Meier survival curves for full cohort (Panel A), and Kaplan–Meier survival curves for restricted cohort (Panel B).
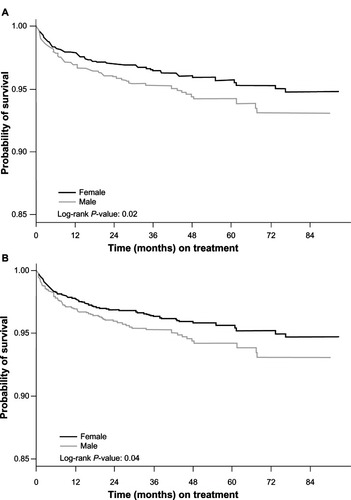
Table 2 Comparing disease progression at baseline between men and women with adjustments for antenatal care
Table A2 Partitioning the effect of gender through the Weibull model for all four cases analyzed
Table A3 Survival analysis using an Accelerated Failure Time model with a Weibull distribution (sensitivity analyses)
Table 3 Survival analysis using an Accelerated Failure Time model with a Weibull distribution
Table 4 Partitioning the effect of gender through the Weibull model