
Figures & data
Table 1 Demographic Characteristics of Study Participants
Figure 1 Pie chart showing prevalence of anemia among HIV patients attending HAART clinic at Hoima Regional Referral Hospital.
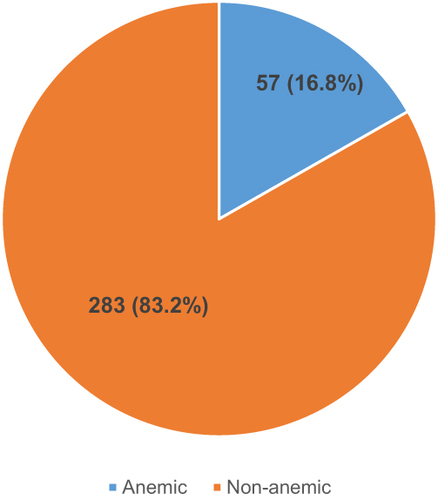
Figure 2 Bar graph showing morphological classification of anemia among HIV patients attending HAART clinic at Hoima Regional Referral Hospital.
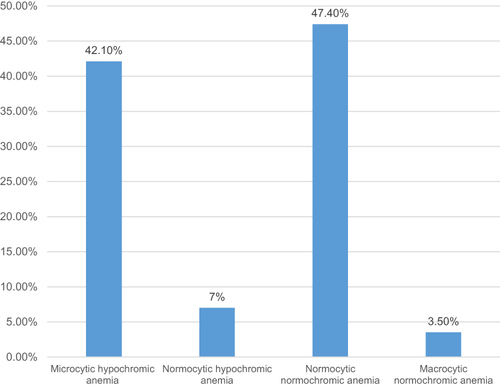
Table 2 Bivariate Analysis of Factors Associated with Anemia Among HIV Patients
Table 3 Multivariate Analysis of Factors Associated with Anemia Among HIV Patients