
Figures & data
Table 1 Socio-Demographic Characteristics of PLHIV Attending at ART Clinics in Illubabor and Buno Bedele Zones, South-West Ethiopia, 2022
Table 2 Clinical and Behavioral Characteristics of PLHIV Attending at ART Clinics in Illubabor and Buno Bedelle Zones, South-West Ethiopia, 2022
Figure 1 IPT exposure status of PLHIV in this study.
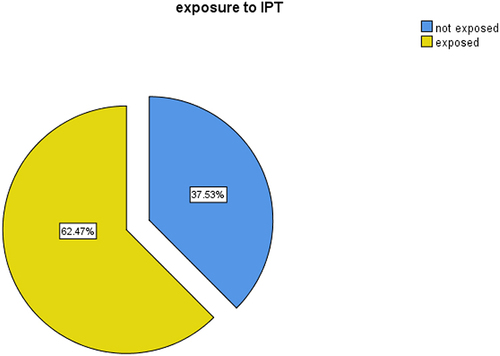
Figure 2 Kaplan–Meier survival probability curve showing time until TB diagnosis among PLHIV in this study.
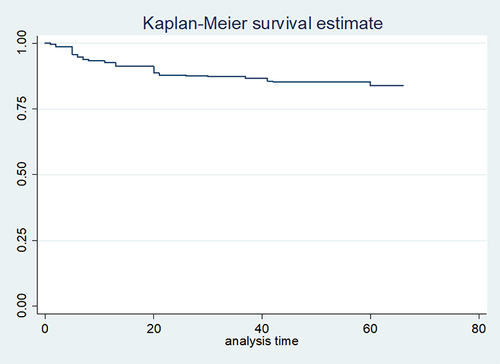
Table 3 Life Table Showing Overall Survival Probability with Ten Years Interval Among PLHIV Attending at ART in Illubabor and Buno Bedele Zones, South-West Ethiopia, 2022
Figure 3 Kaplan–Meier curve showing survival probability between different categories of age among PLHIV.
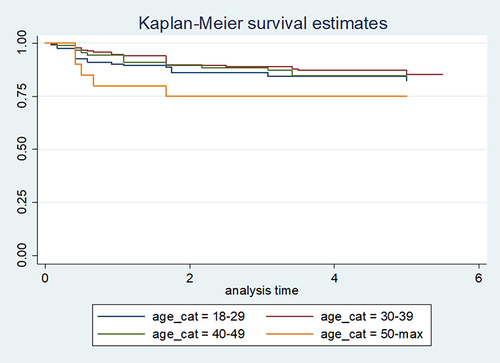
Figure 4 Kaplan–Meier curve showing survival probability between categories of IPT exposure status.
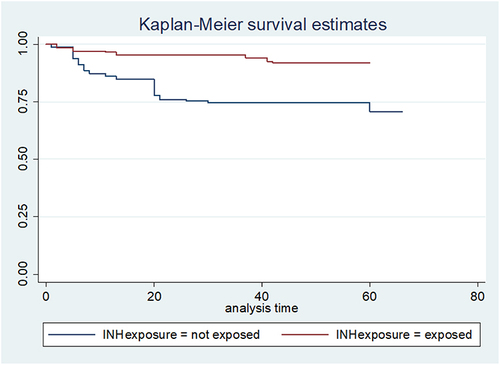
Table 4 Multivariable Cox Regression Analysis of Predictor Variables for Time to TB Among PLHIV Attending at ART Clinics in Illubabor and Buno Bedelle Zones, South-West Ethiopia, 2022