Figures & data
Figure 1 Distribution of MSM sentinel surveillance sites (n=10) in Sichuan, 2018–2022.Map created by ArcGIS 10.7 software (ESRI Inc., Redlands.CA.USA).
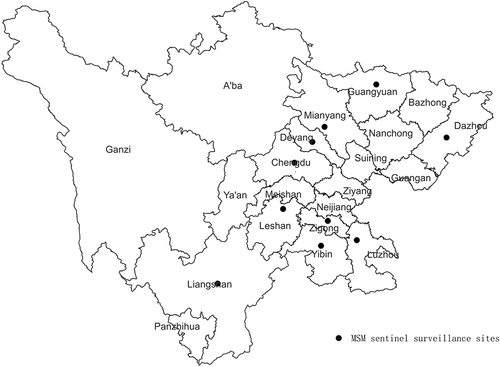
Table 1 HIV-1 Prevalence and Incidence Year by Year from 10 MSM Sentinel Surveillance Sites
Figure 2 The trends of HIV-1 prevalence and incidence during the surveillance period between 2018 and 2022 among men who have sex with men in Sichuan, China.
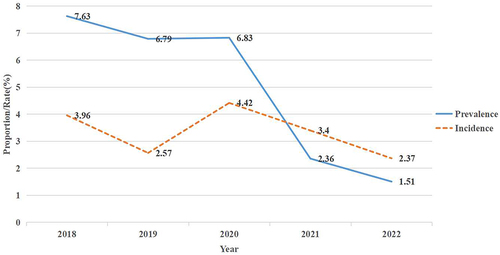
Table 2 HIV-1 Prevalence and Incidence from Different MSM Sentinel Surveillance Sites
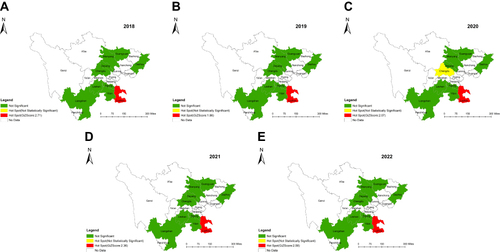
Figure 3 Hot-spots of HIV-1 recent cases at city level by year among MSM between 2018 and 2022. (A) Sichuan province, 2018. (B) Sichuan province, 2019. (C) Sichuan province, 2020. (D) Sichuan province, 2021. (E) Sichuan province, 2022.