
Figures & data
Table 1 Socio-Demographic Characteristics of ART Clients on Treatment at in Amhara Region, Ethiopia, January 30, 2016-January 30, 2021 (n = 860)
Table 2 Treatment and HIV/AIDS-Related Characteristics Among Second-Line ART Clients on Treatment in Amhara Region, Ethiopia, January 30, 2016-January 30, 2021
Figure 1 Overall Kaplan-Meier estimate for second-line ART clients on treatment in Amhara region, Ethiopia.
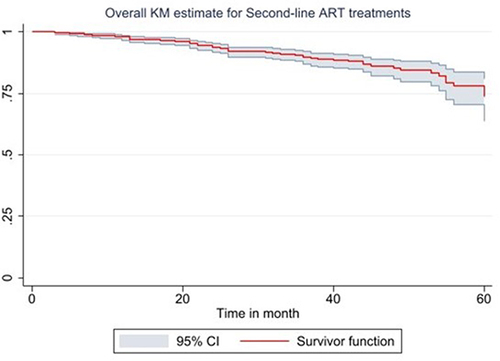
Table 3 Summary of Model Comparisons for the Survival Sub-Models
Table 4 Factors Associated with Second-Line ART Treatment Failure Among ART Clients in Amhara Region, Ethiopia, January 30, 2016–January 30, 2021
Data Sharing Statement
All result-based data are available within the manuscript and supporting information. The dataset used for this analysis can be provided after a reasonable request of the corresponding author.