
Figures & data
Table 1 Characteristics of study participants
Figure 1 Distribution of education by age group according to HIV status.
Abbreviation: HIV, human immunodeficiency virus.
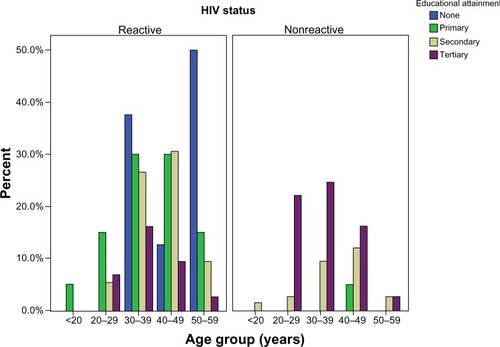
Figure 2 Distribution of income per month in Naira by age group according to HIV status.
Abbreviation: HIV, human immunodeficiency virus.
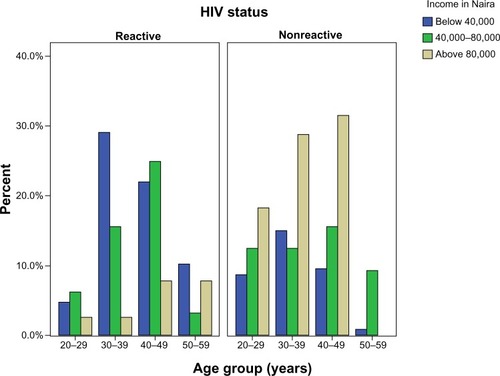
Table 2 Multivariate binary regression model relating HIV infection to socioeconomic variables and confounders