
Figures & data
Table 1 Demographic and laboratory characteristics in the placebo and L-carnitine supplementation arms
Figure 1 Patient disposition. Patients were screen for inclusion and exclusion criteria and randomized into two arms, ie, sham and L-carnitine supplementation. Patients were stratified by hemoglobin level.
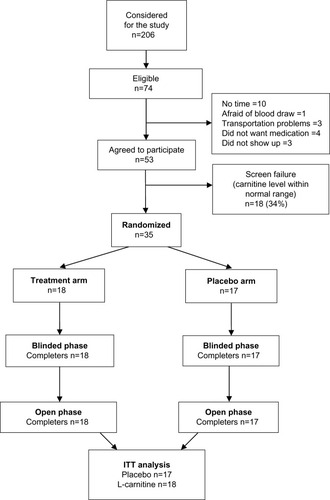
Table 2 Comparison of carnitine levels, lactate levels, and primary and secondary outcomes between baseline and the end of the placebo-controlled phase: results of mixed model regression based on intent-to-treat
Table 3 Comparison of carnitine levels and primary and secondary outcomes between the end of the placebo phase and the end of the open-label phase
Table 4 Comparison of side effects between placebo and L-carnitine supplementation arm by the end of the placebo-controlled phase (P>0.05)